Analysis
Profile #4 — The post-blackout winners club: location dictates, owner ranks
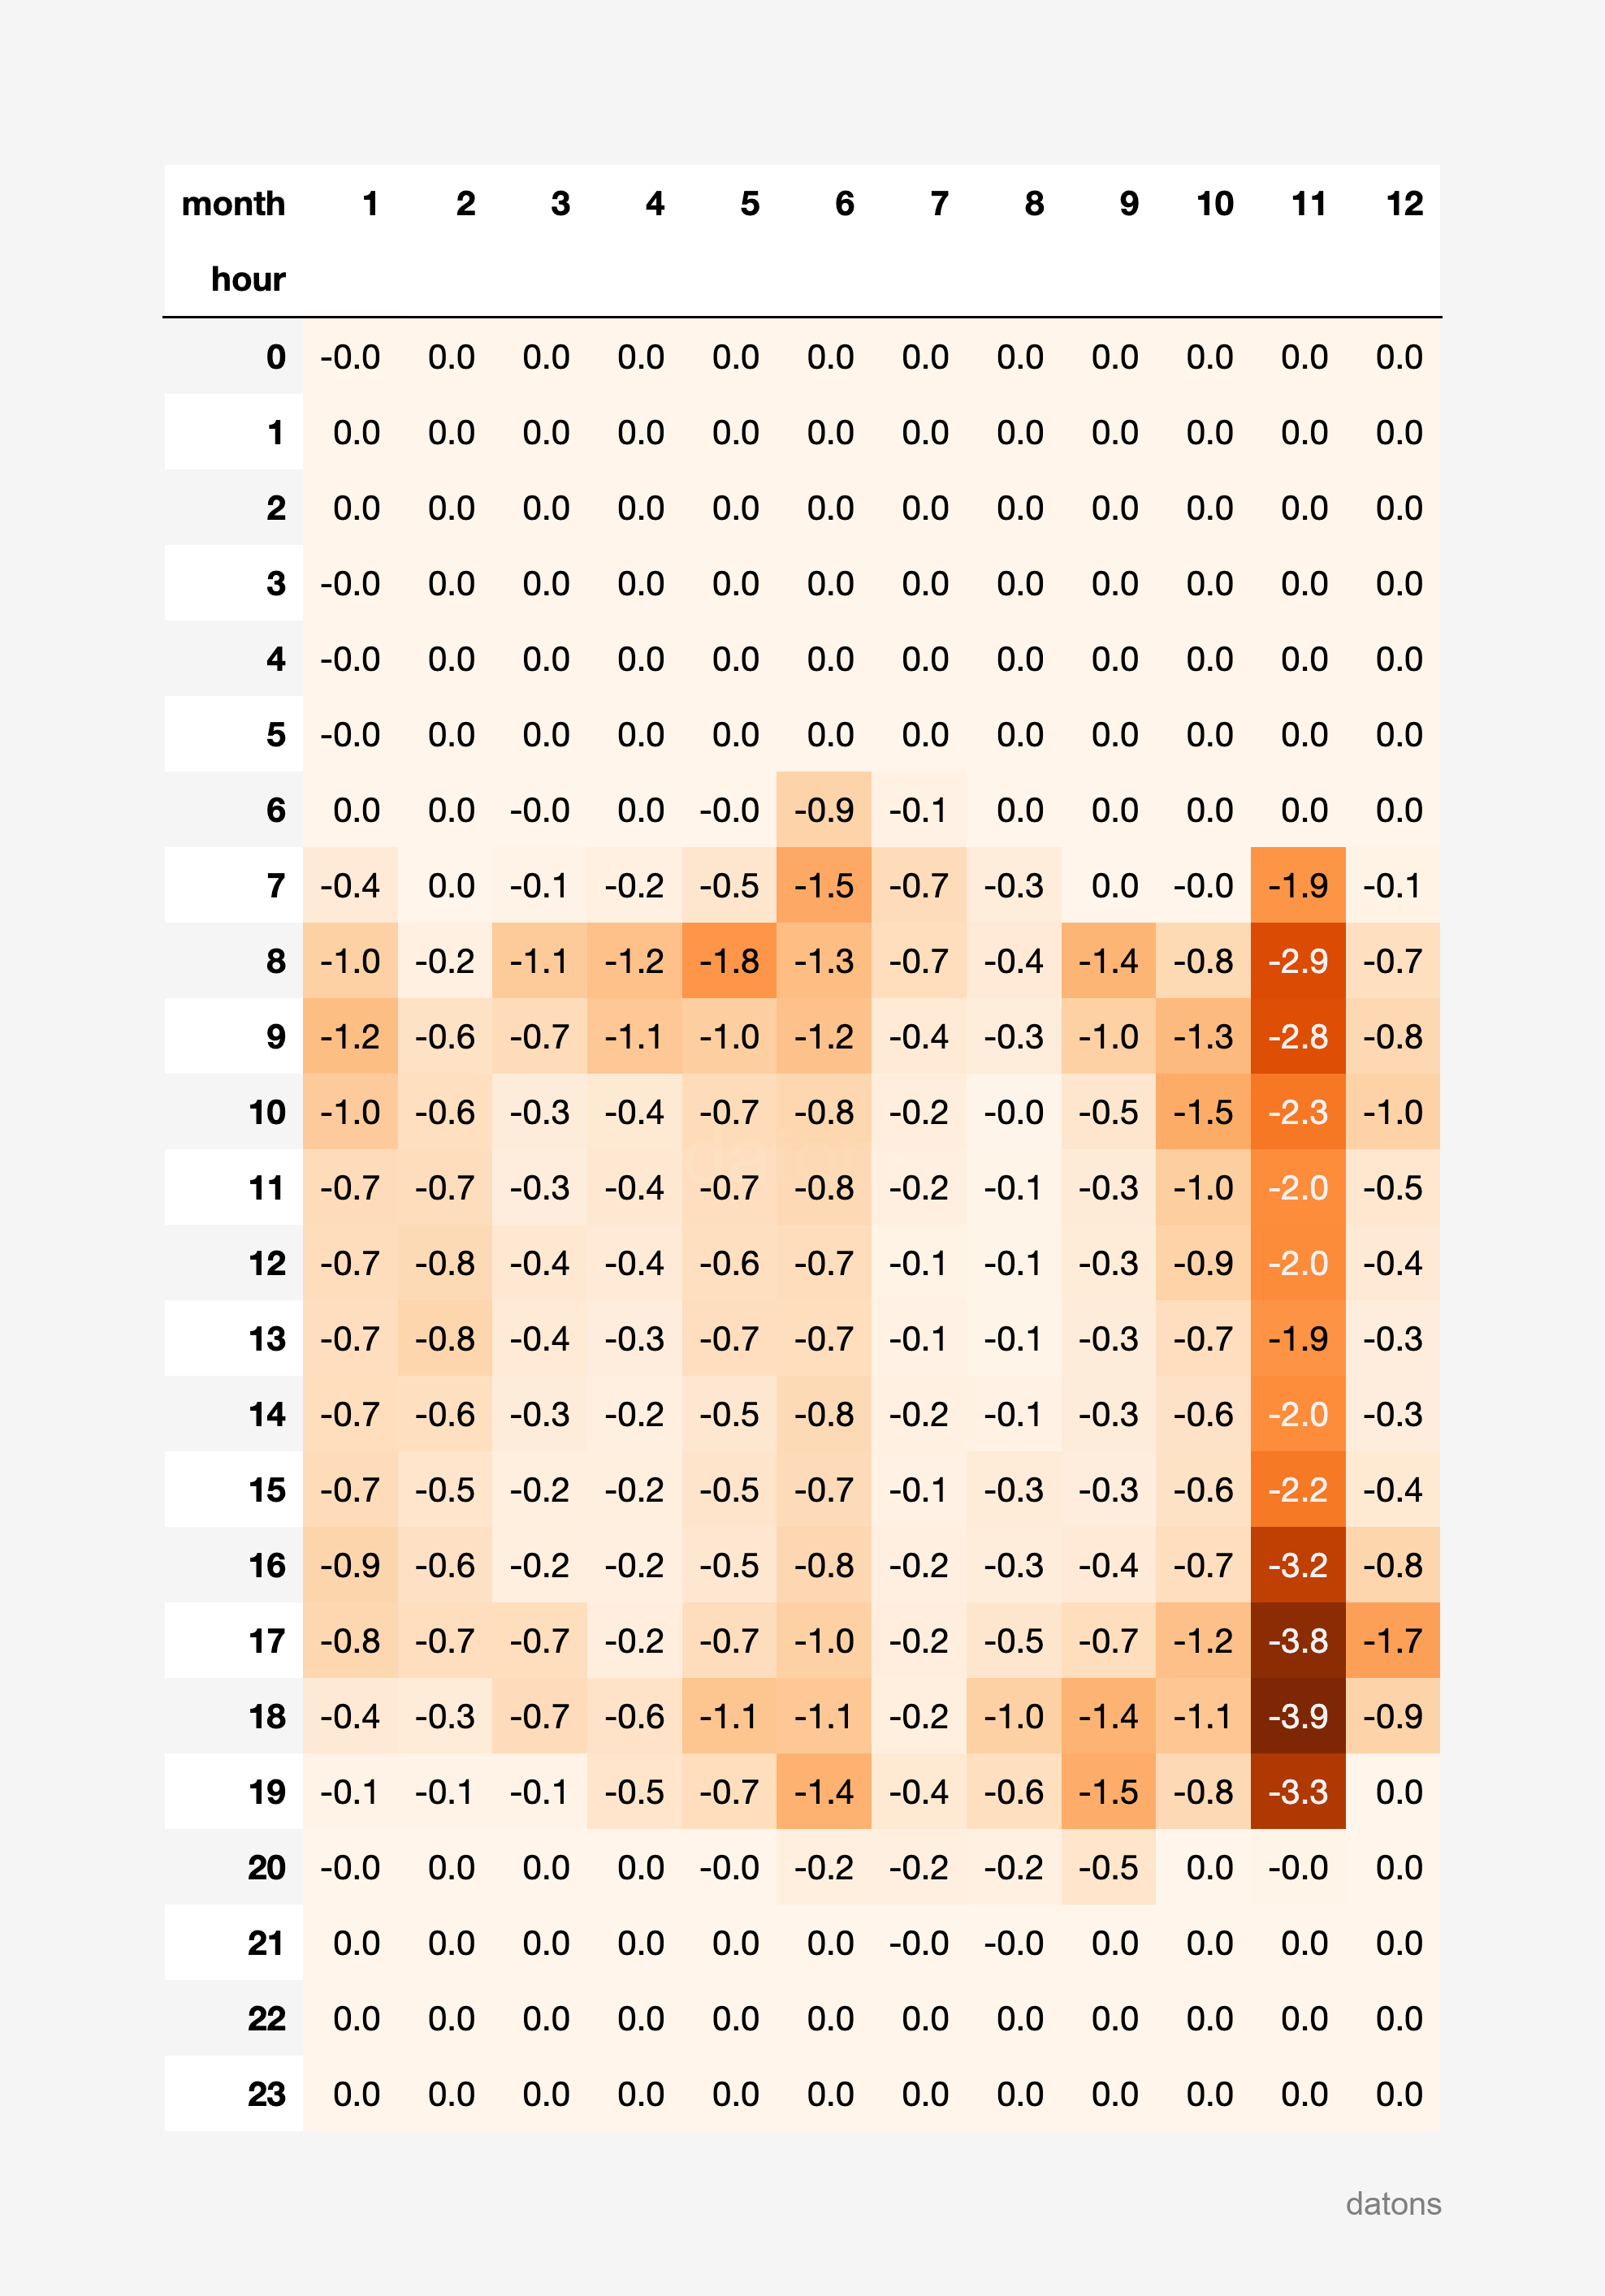
Recap of three profiles (ContourGlobal/Arrubal, TotalEnergies/Castejón, Castleton/Amorebieta) and the unifying thesis: location determines whether a CCGT participates in Operación Reforzada redispatch at all; within a participating cluster, the owner decides whether you win or lose. Renewable-saturated nodes select; the rest of the market is a footnote.