Who would have been the lucky ones who bought NVIDIA shares before they went up 20% in a single day?
In this tutorial, we will calculate the stock returns of NVIDIA to analyze their statistical behavior.
Data
Thanks to the yfinance library, we can download the stock data of NVIDIA with its ticker NVDA.
import yfinance as yf

df = yf.download('NVDA')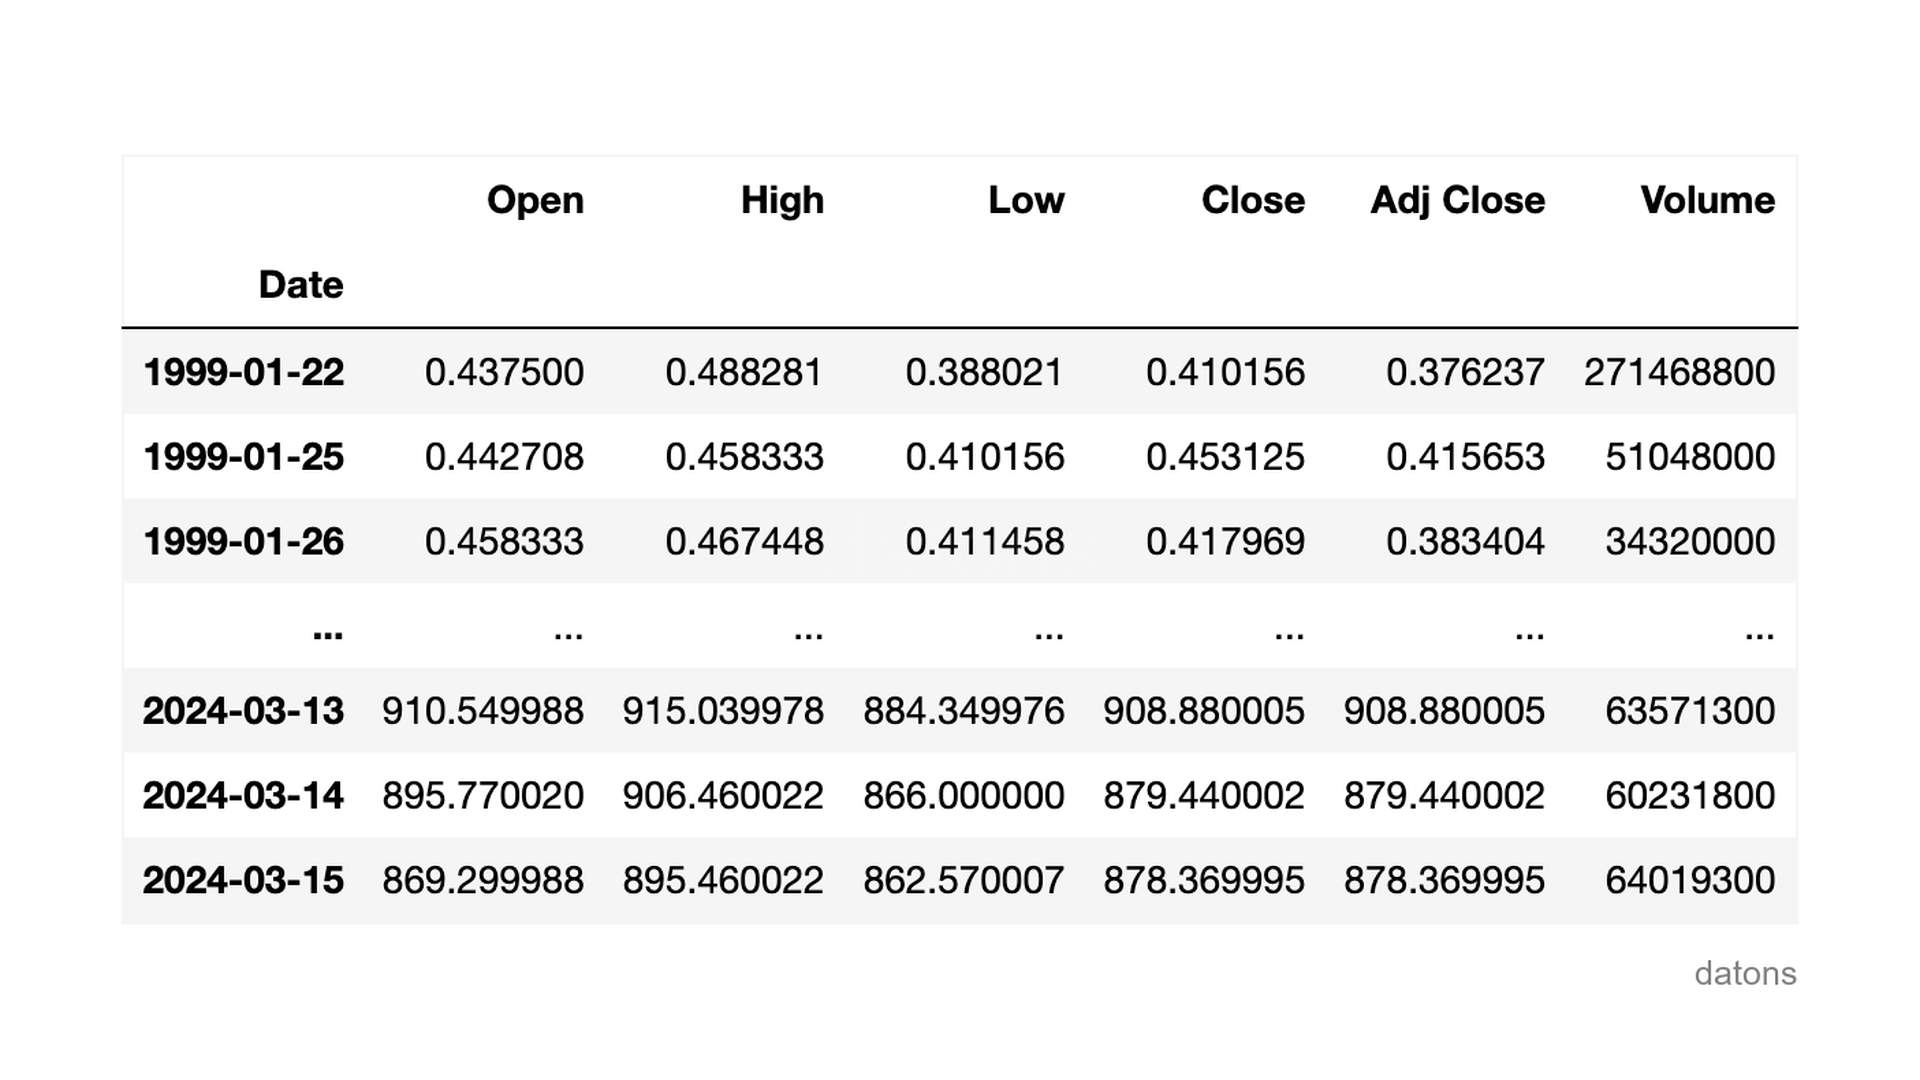
Questions
- How to download stock data of a specific company using Python?
- What command allows filtering data by specific dates?
- How is the daily return of a stock calculated?
- What is the method to visualize the distribution of daily return?
- How to interpret the distribution of daily return?
- How is the cumulative return of an investment calculated?
Methodology
Filtering dates of interest
We use loc to filter the table from the start of the 2020s to today.
df = df.loc['2020-01-01':]Let’s visualize the evolution of the closing prices on the stock exchange.
df['Adj Close'].plot()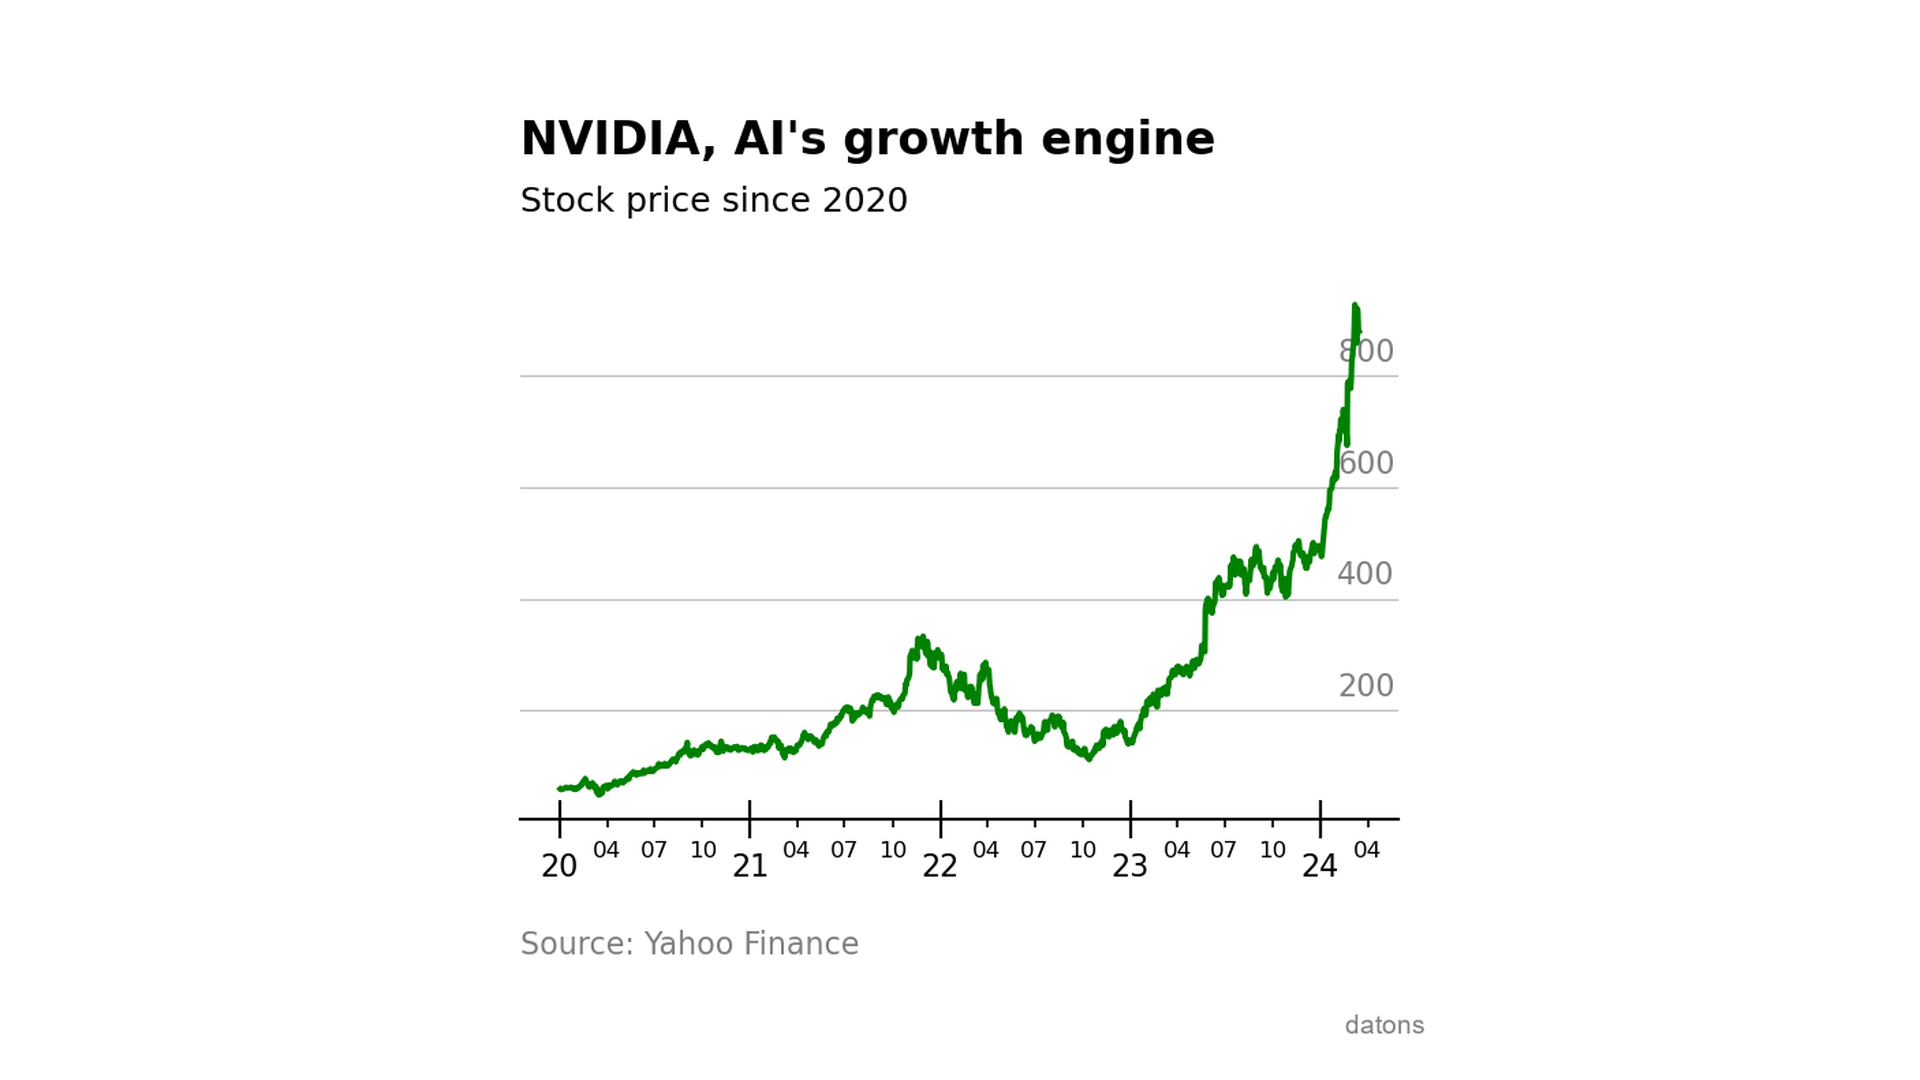
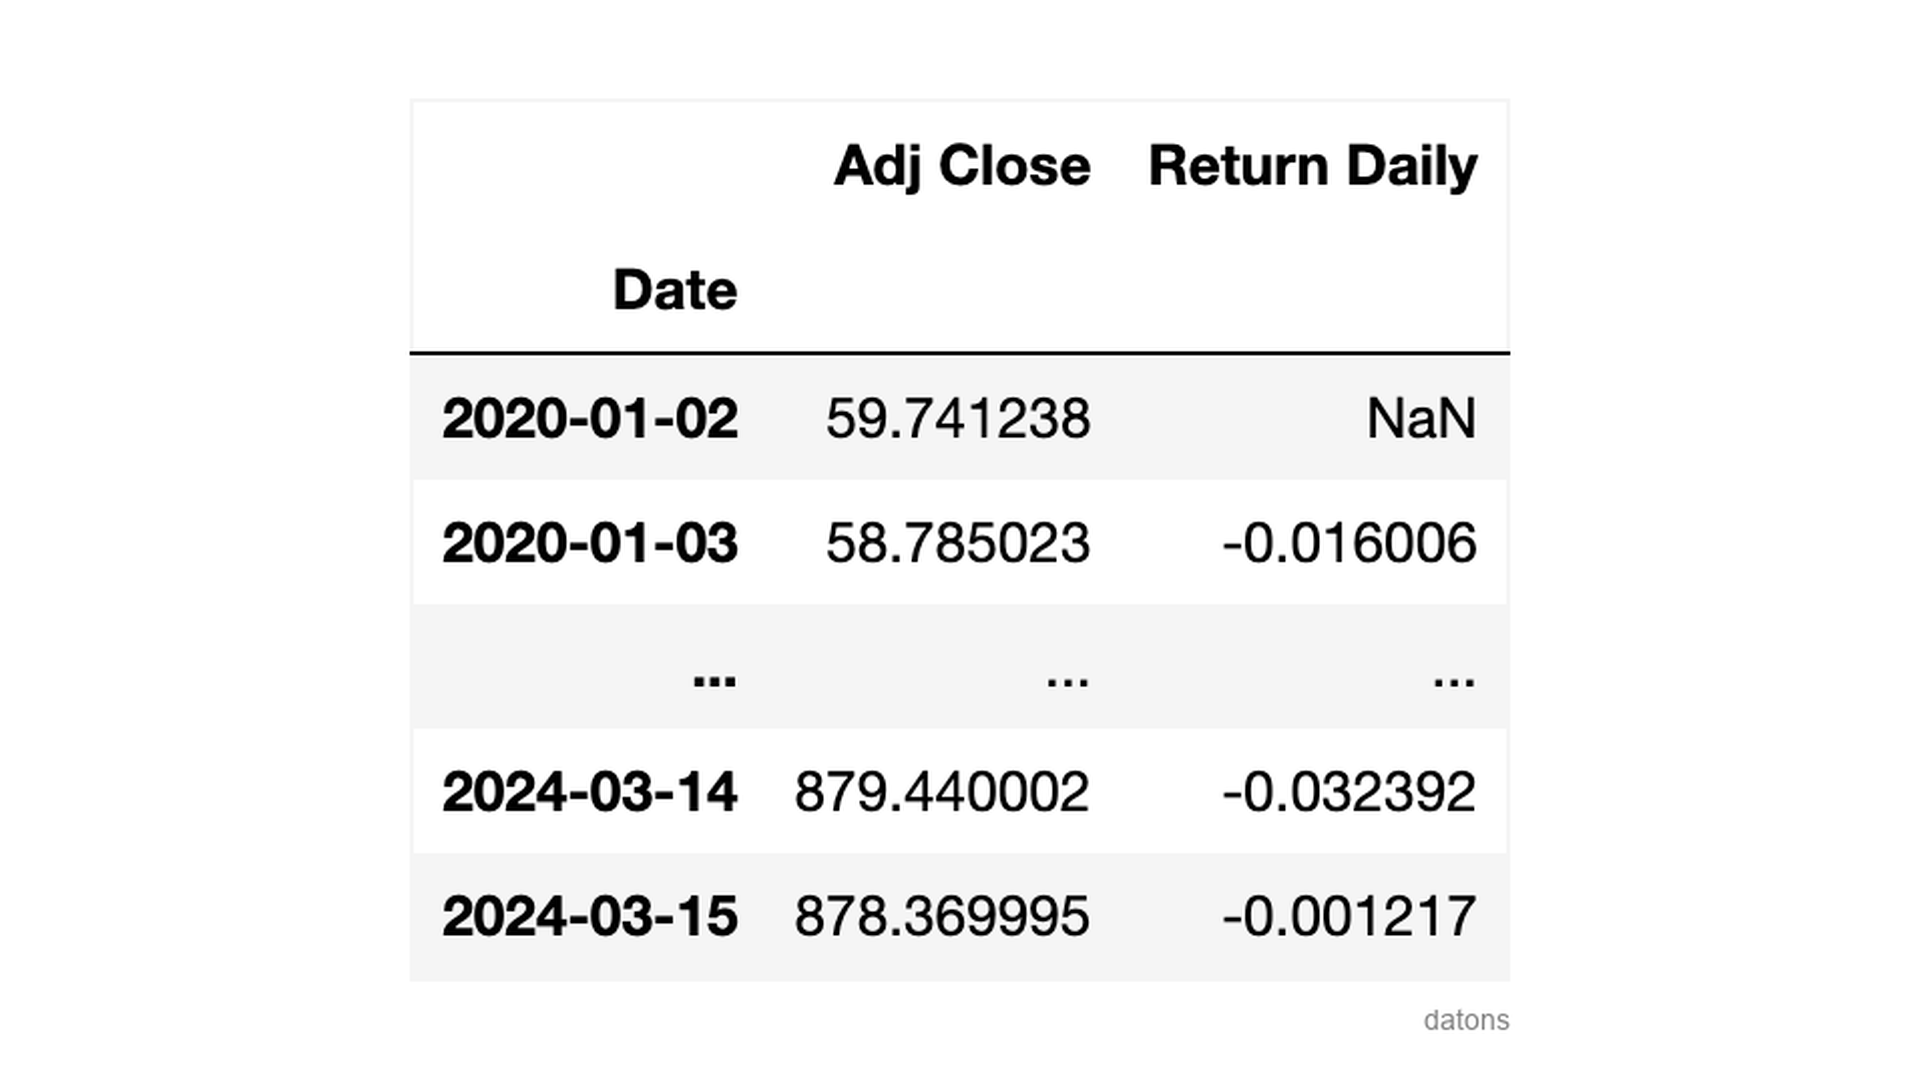
Daily return
We use the pct_change function to calculate the daily return, which is nothing more than the percentage variation of the closing price compared to the previous day.
df['Return Daily'] = df['Adj Close'].pct_change()The first day has no return, as there is no previous day to compare it with.
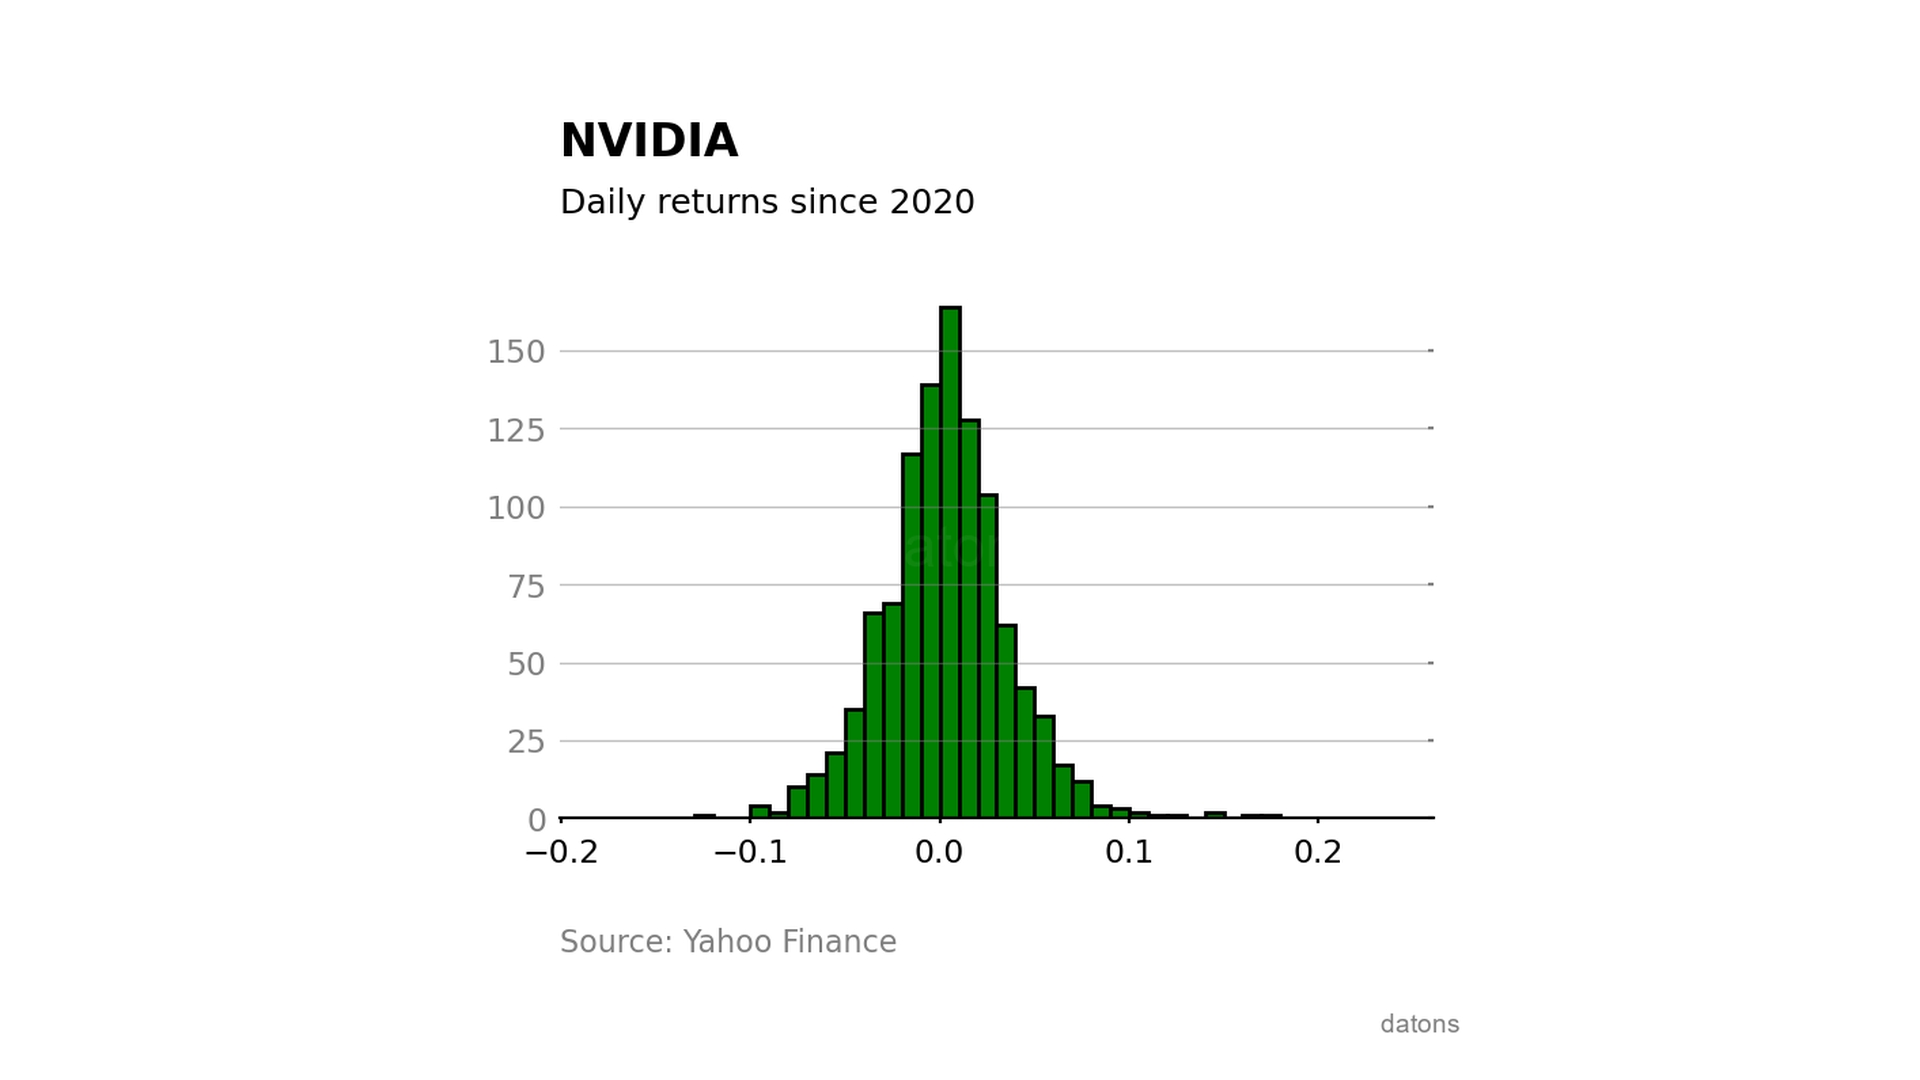
Distribution of daily return
Observing the distribution of daily returns, we see that the stock went down almost 20% in a single day.
On the positive side, the maximum daily return exceeded 20%.
Blessed are those who bought the day before the 20% rise (blessed are those who bought the day before).
df['Return Daily'].plot.hist(bins=50)Following a normal distribution, we can say with 68% confidence that the daily return will be between 0.00312 \(\) 0.0342 (\(\)). That is, between -3.1% and 3.7%.
df['Return Daily'].describe()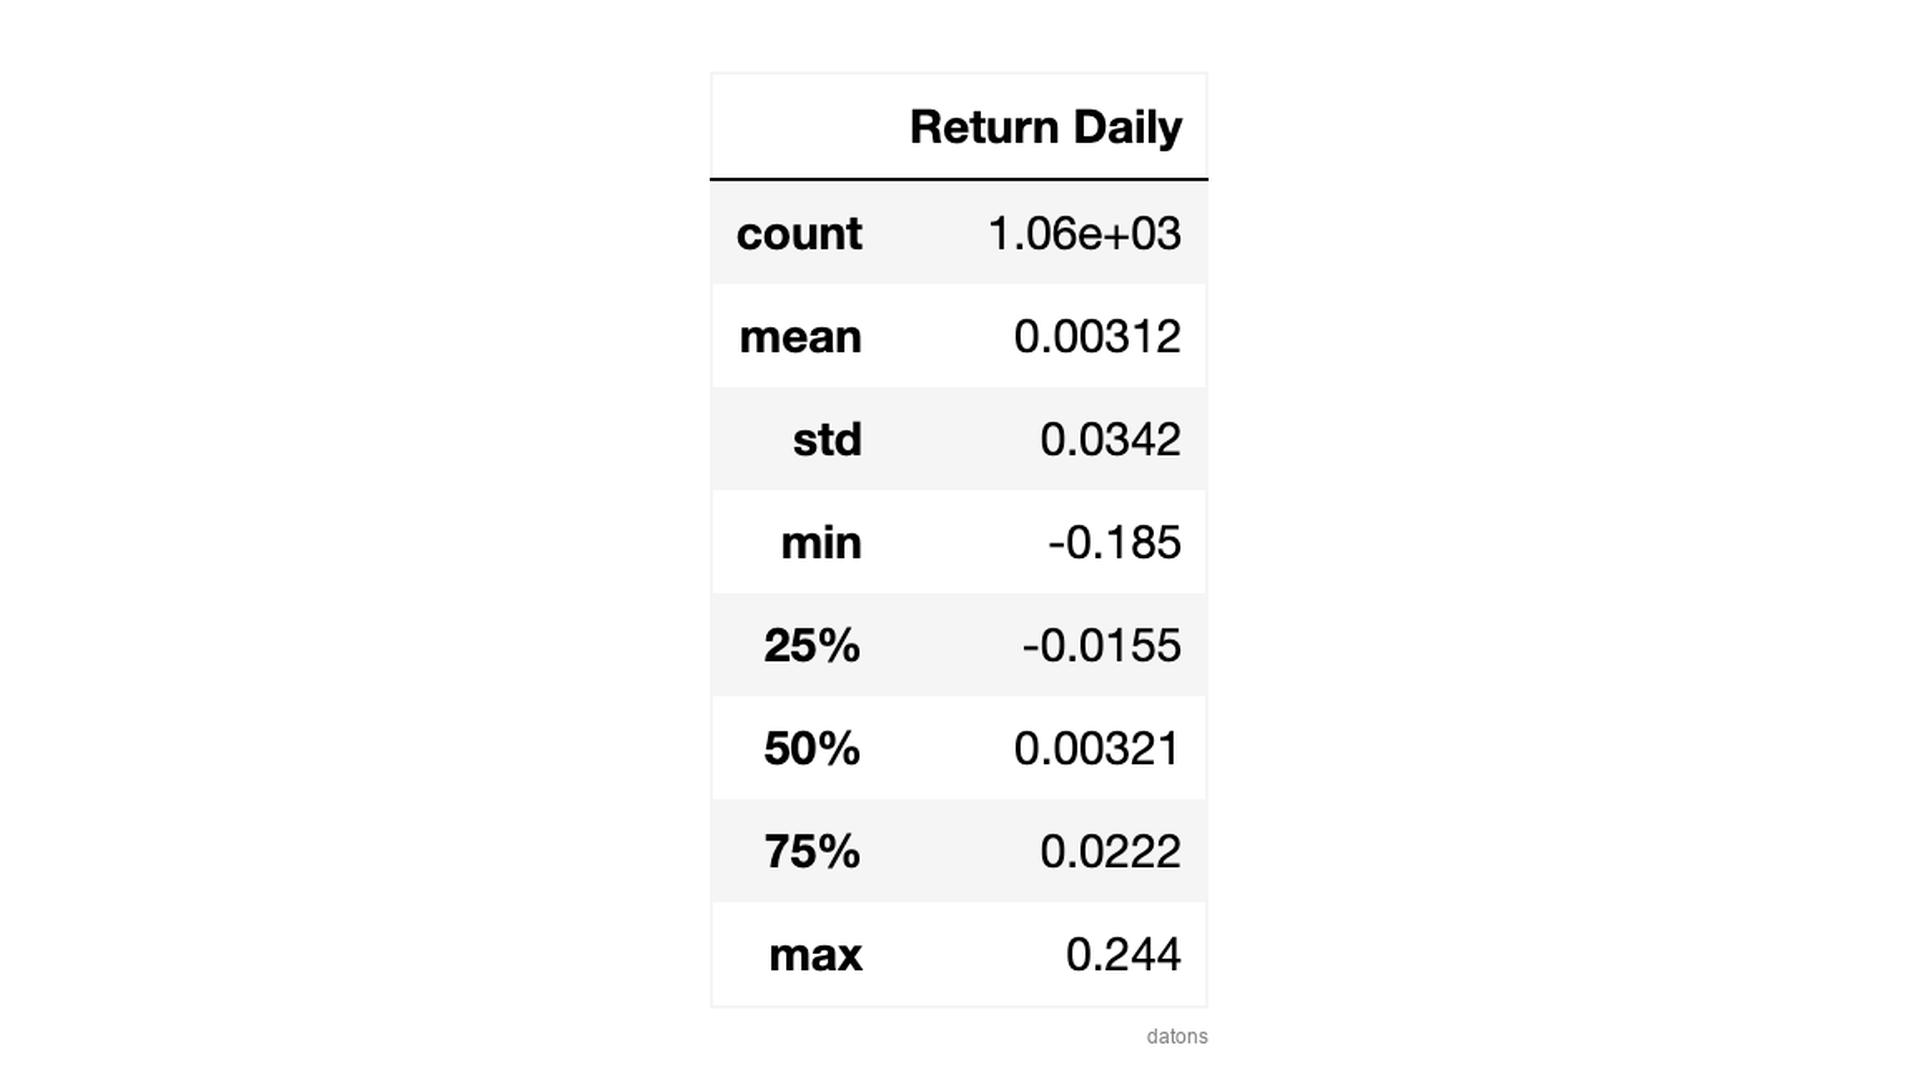
Cumulative return
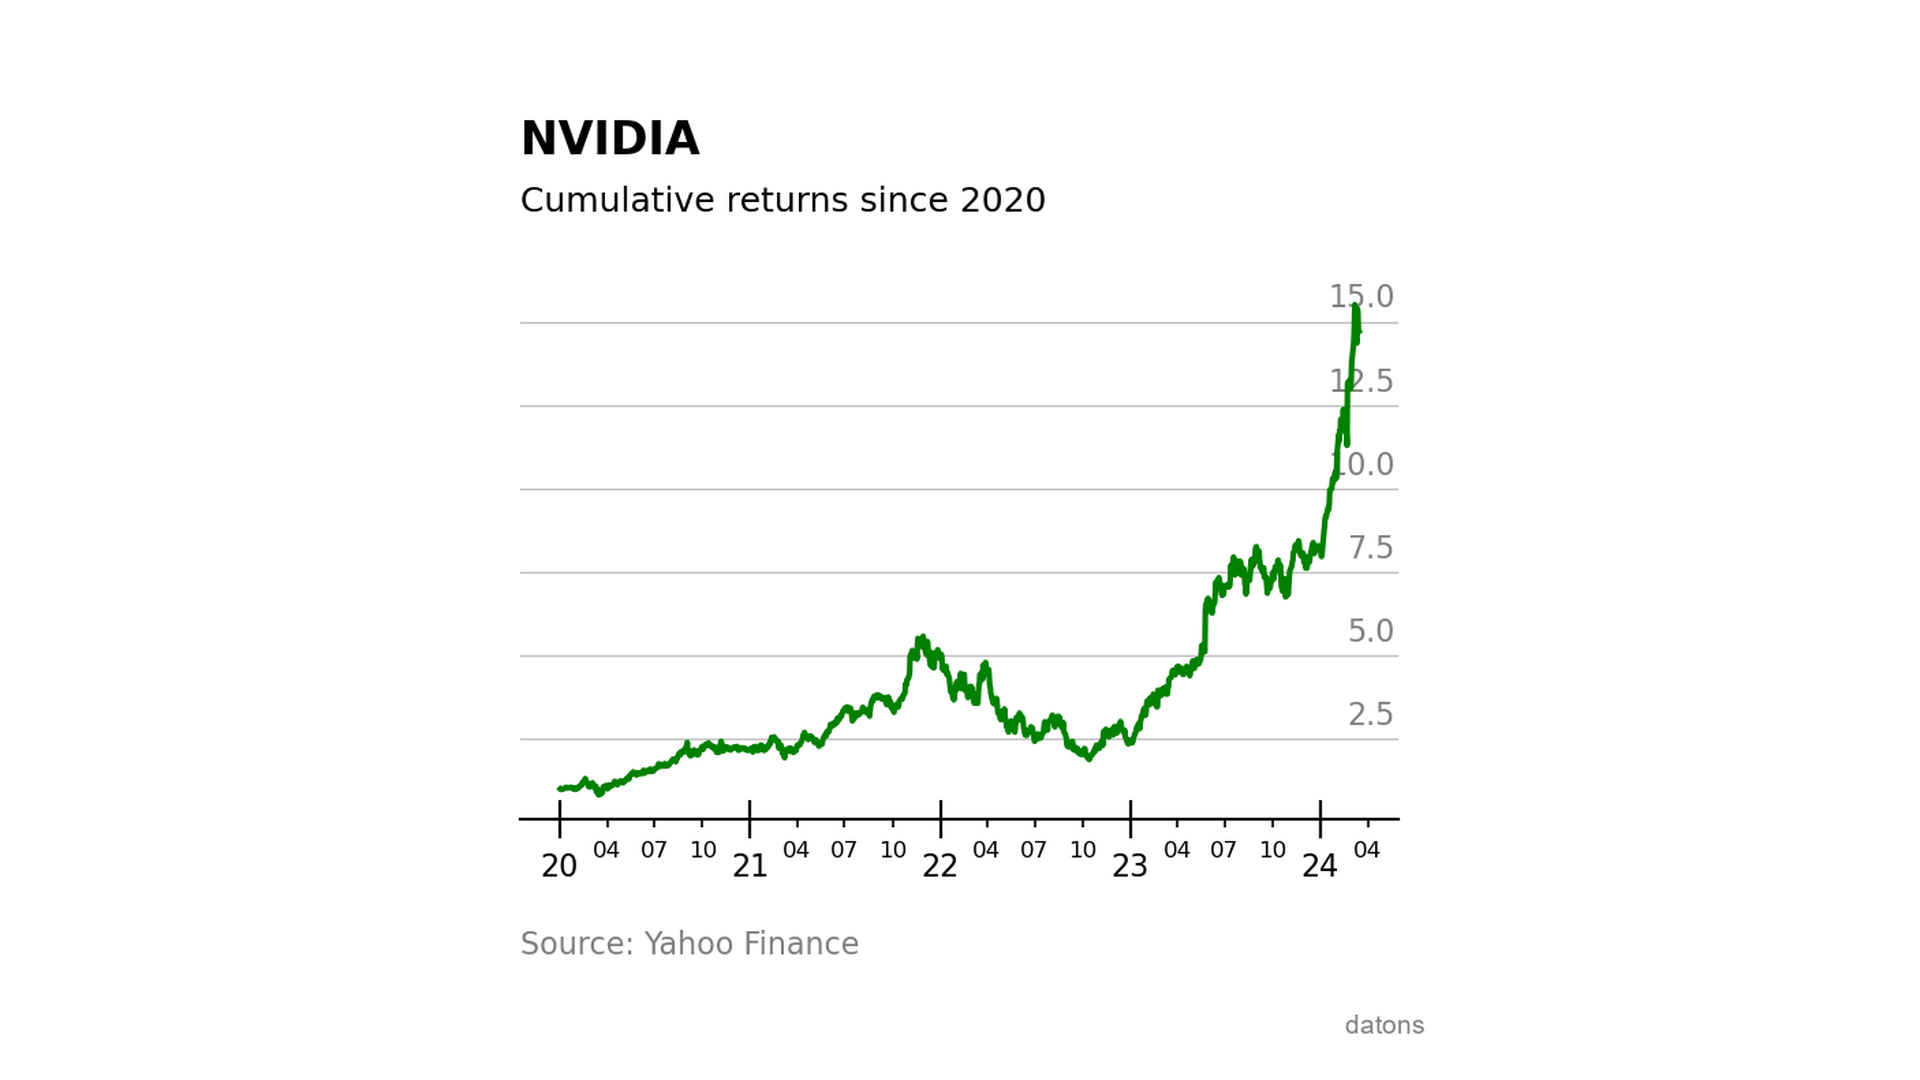
Lastly, let’s calculate how much money we would have for each dollar invested if we had bought theshare at the start of the decade.
df['Return Cumulative'] = (df['Return Daily']
 .fillna(0)
 .add(1)
 .cumprod()
)
Wow, every dollar invested in NVIDIA’s stock at the start of the decade would have turned into around 15 dollars.
If you want to delve into financial data programming with Python, this may interest you.
Conclusions
- Stock Data Download:
yf.downloadallows downloading the stock data of a company using its ticker. - Date Filtering:
loc['YYYY-MM-DD':]filters the data for a specific date range. - Daily Return Calculation:
pct_changecalculates the percentage variation between consecutive rows. - Visualization of the Return Distribution:
plot.histdisplays the distribution of daily returns, representing the stock’s volatility. - Interpretation of the Return Distribution:
describeto get statistical values and estimate the range of returns we can expect with a certain level of confidence. - Cumulative Return:
cumprodcalculates the cumulative product to take into account the effect of reinvesting returns.
Keep reading
Related articles you might enjoy
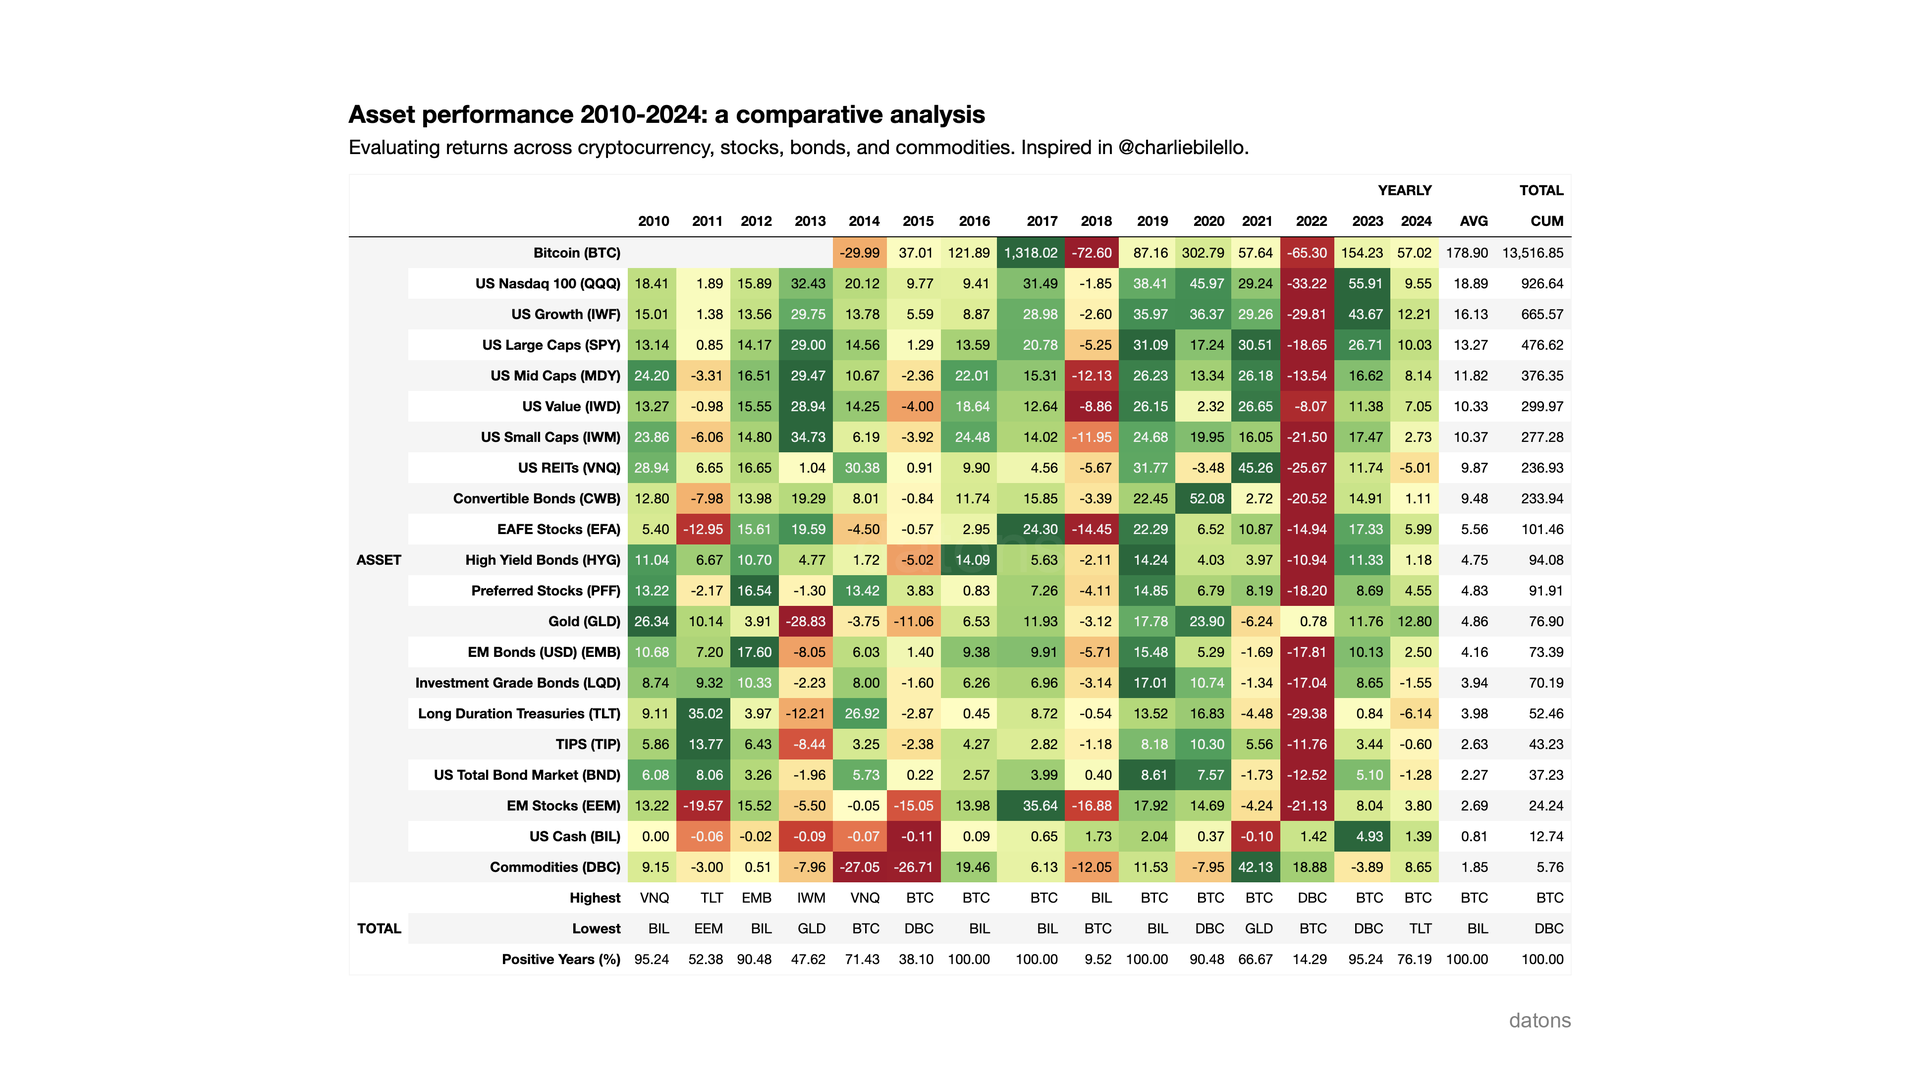
Reporting annual cumulative returns on multiple assets in Python
Learn how to process multiple financial assets and include them in a report highlighting each asset's annual performance.
Read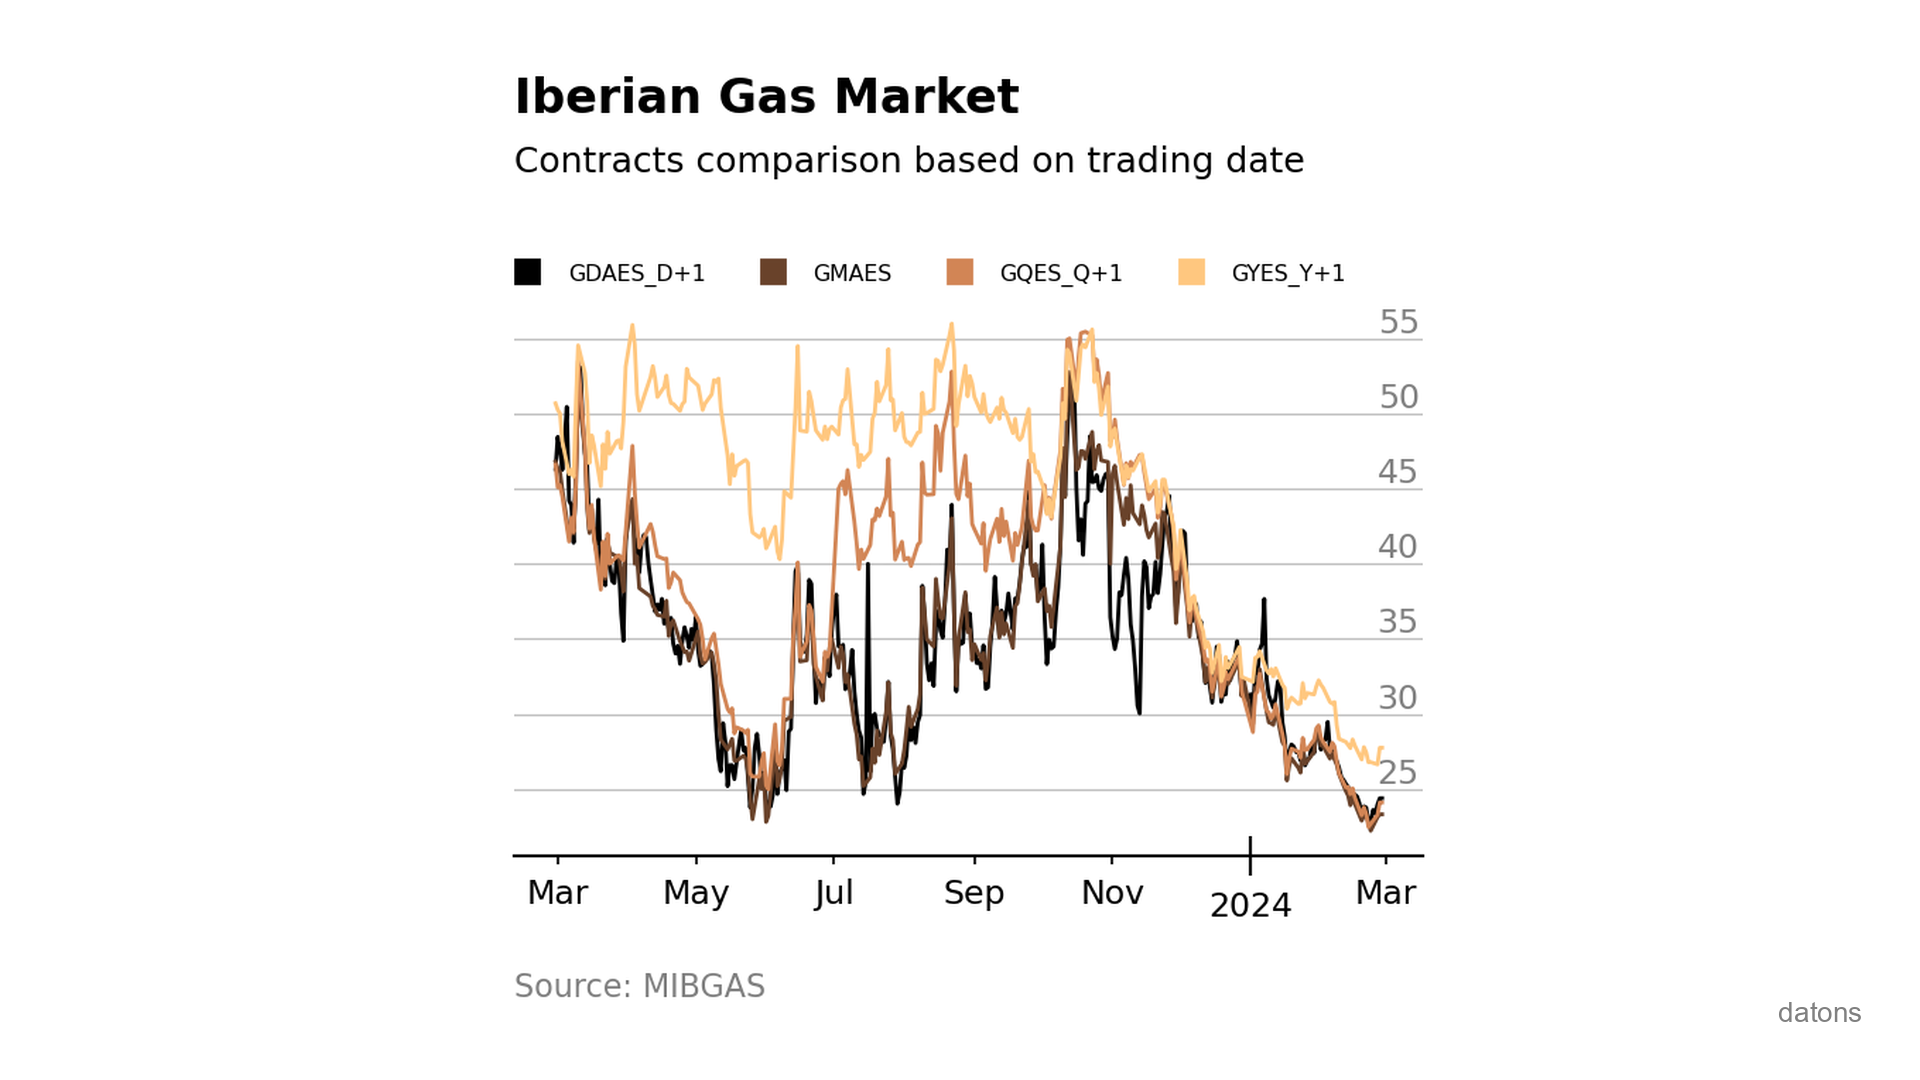
Visually comparing contracts from Iberian gas market MIBGAS
Discover how to analyze and visualize MIBGAS contract prices using Pandas and Matplotlib. This tutorial guides you through data filtering, date handling, and interpolation techniques.
Read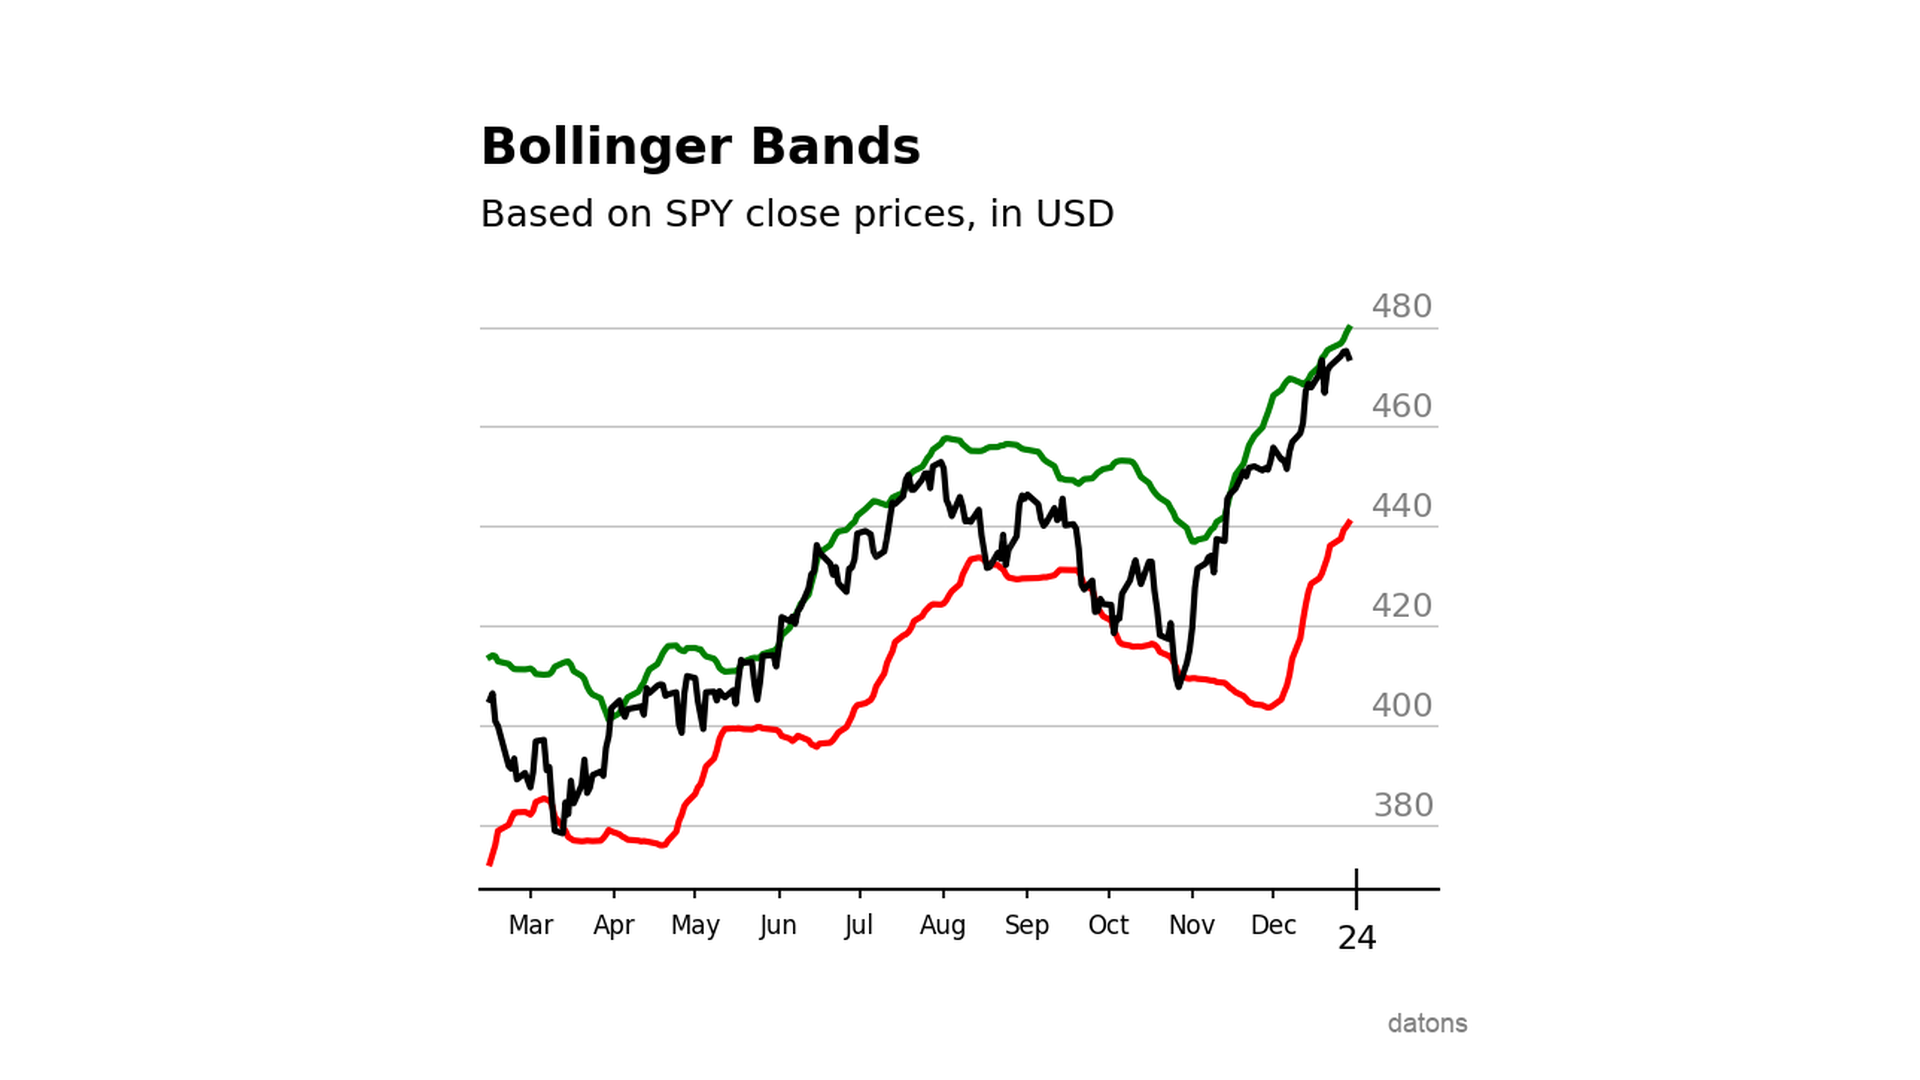
Bollinger Bands with Python applied to the S&P500
Using Bollinger Bands, we can create a trading strategy to buy and sell stocks based on the market's moving volatility.
Read