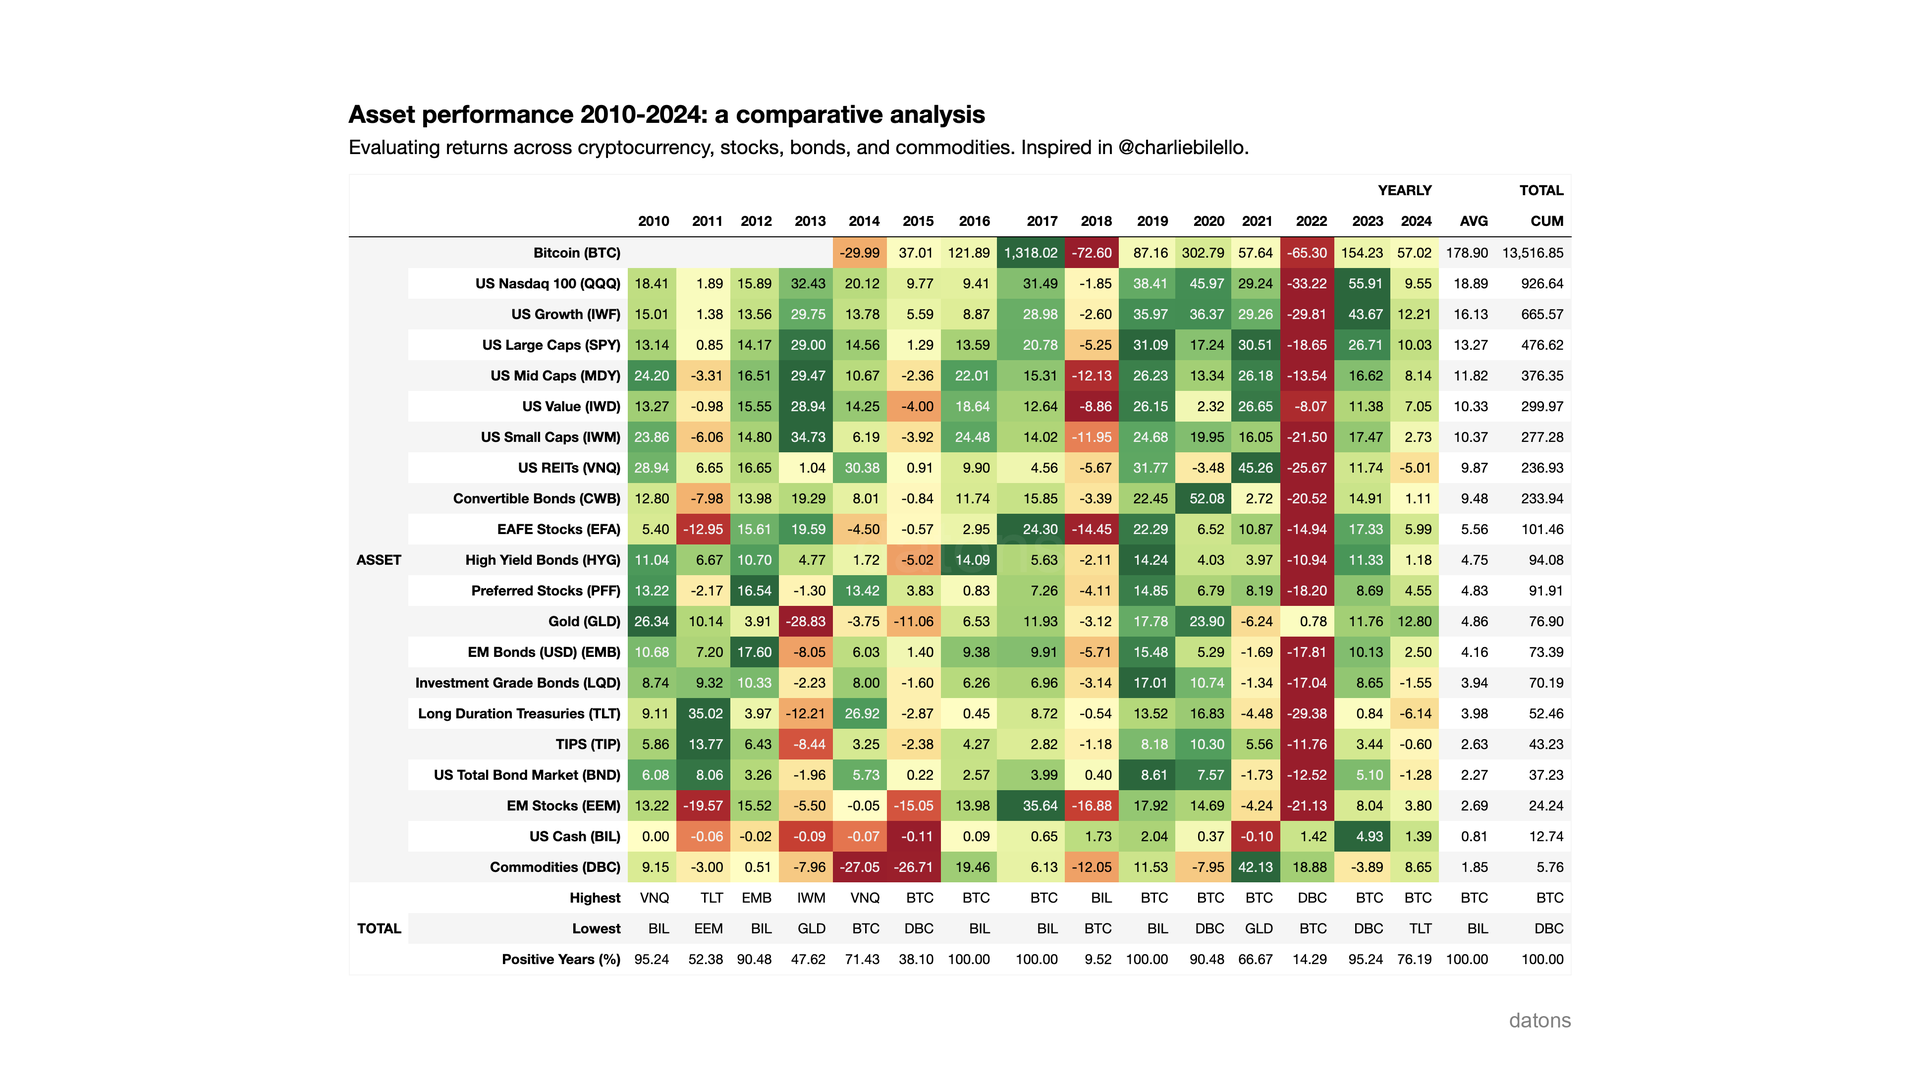
When comparing the performance of financial assets like Bitcoin, ETFs, and stocks, which was the most profitable asset since 2010?

In this tutorial, we explain how to download, process, and report on the performance of financial assets using Python.
The report is inspired by Charlie Bilello’s analyses.
Data
We define the list of tickers for the assets to analyze.
tickers = ['BTC-USD', 'QQQ', 'IWF', 'SPY', ...]We download daily historical price movements using the yfinance library, which downloads data from Yahoo Finance.
import yfinance as yf
df = yf.download(tickers)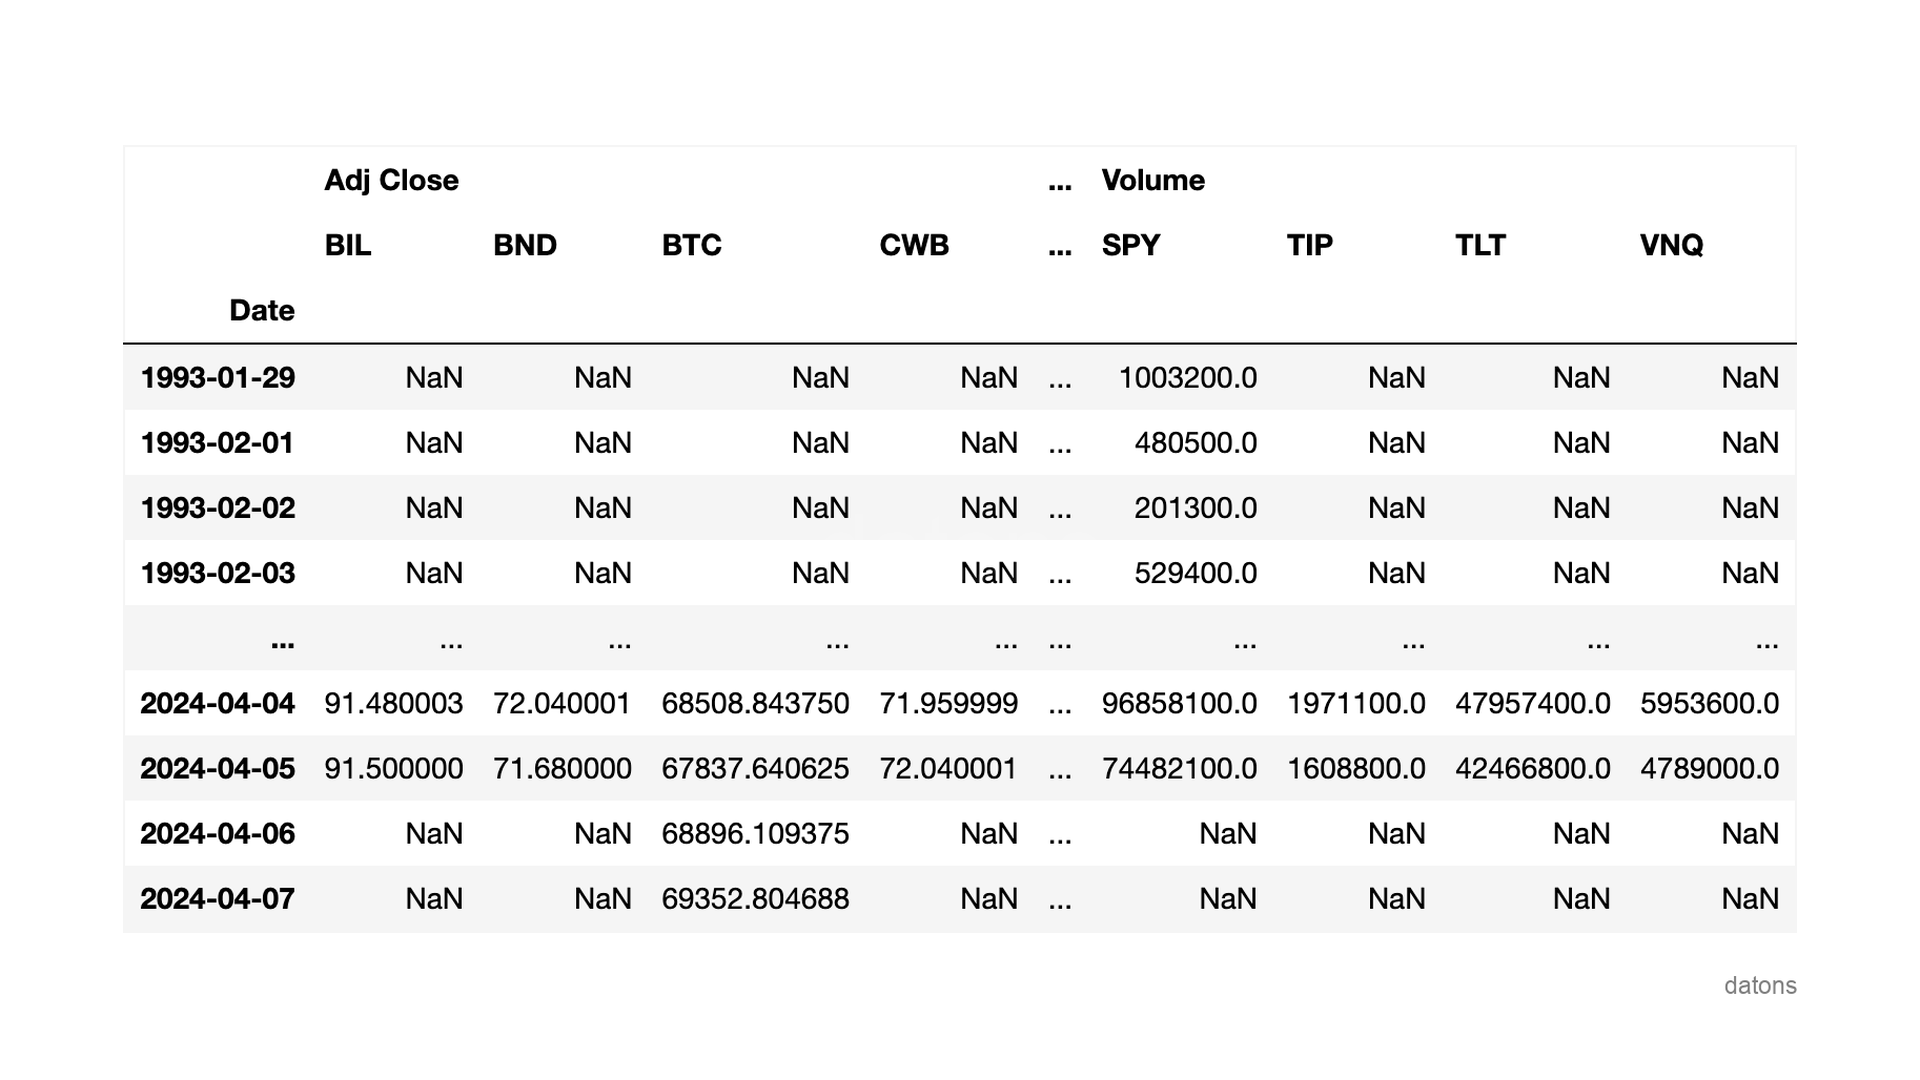
Questions
- How to download historical price data for multiple financial assets?
- How to calculate the annual cumulative return of each asset?
- Why is it necessary to group data for cumulative calculations?
- How to select the last day of cumulative return in each year?
- How to identify the maximum and minimum return values in each year?
- How to calculate the percentage of positive returns for each asset?
Methodology
Annual cumulative return
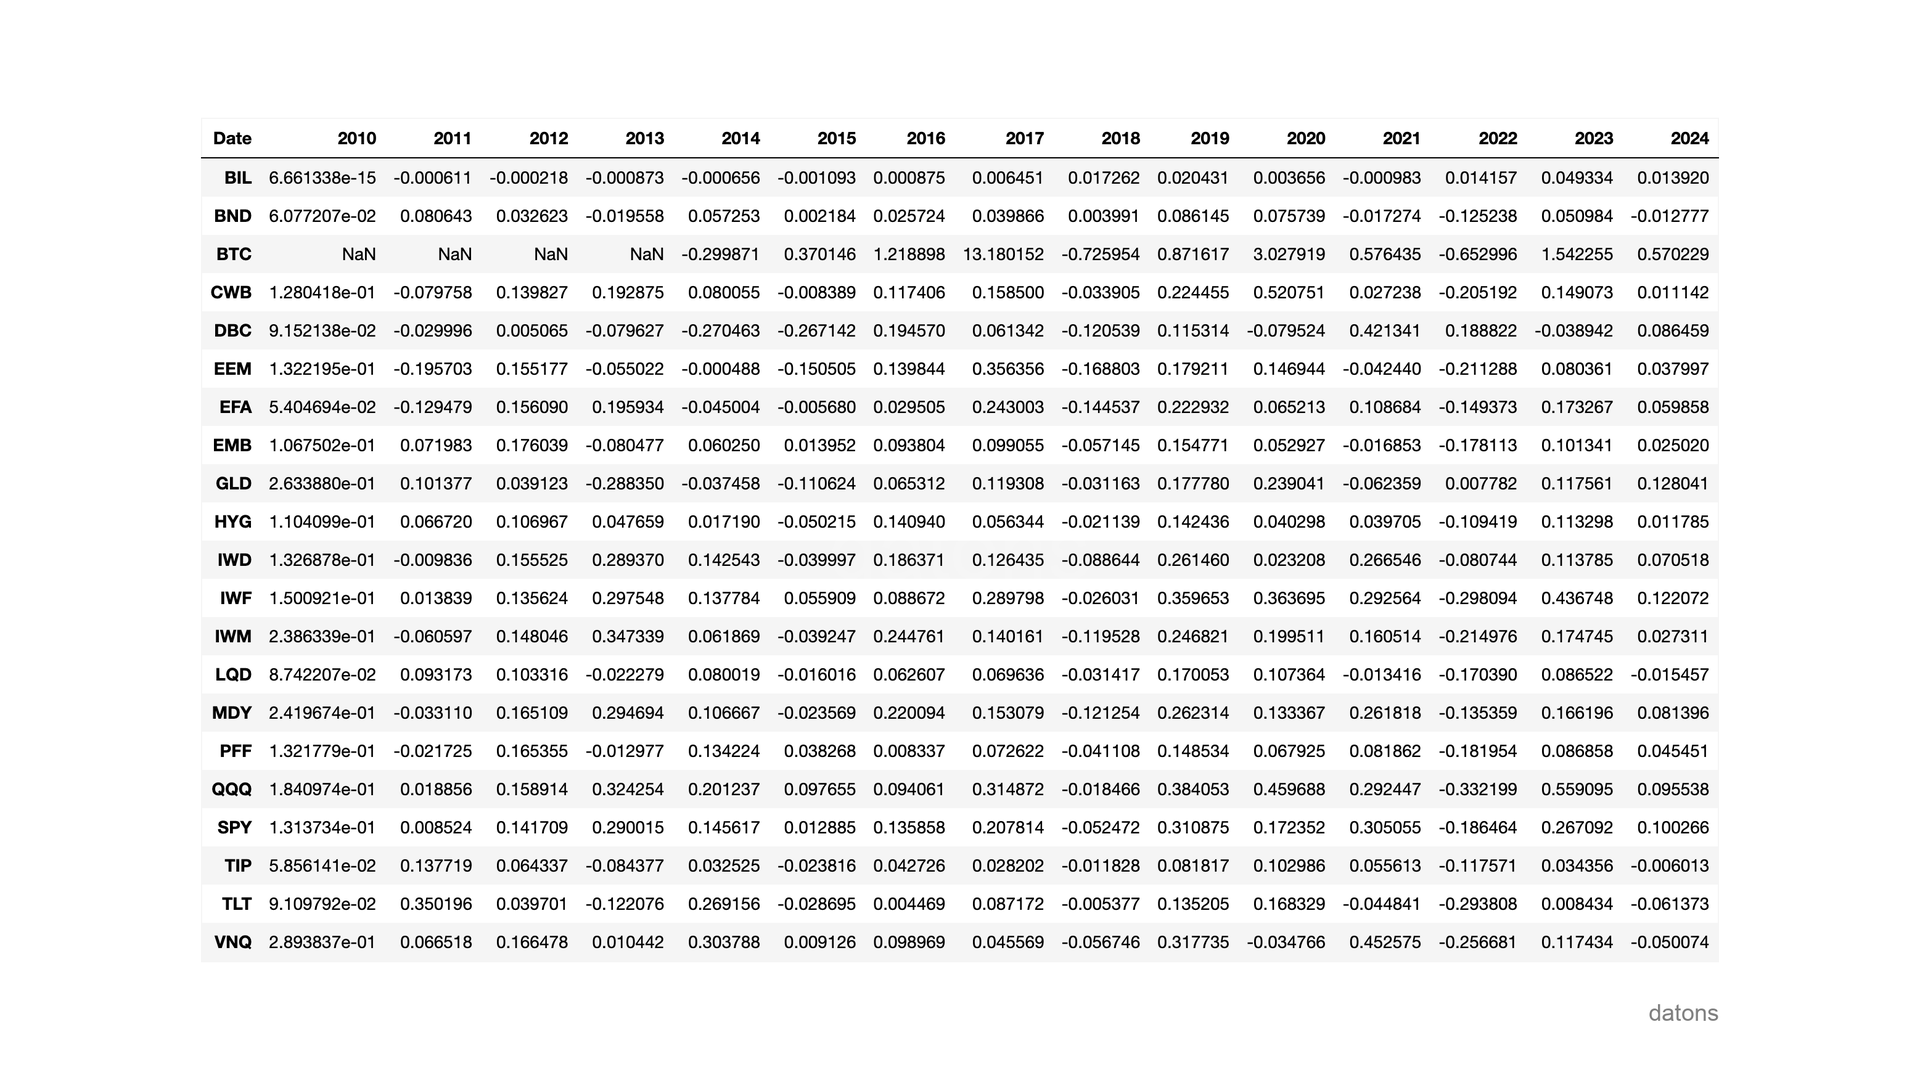
We select the adjusted closing prices Adj Close from 2010 and calculate the annual cumulative return, choosing the last business day of each year.
(df
 .loc['2010':, 'Adj Close']
 .groupby(df.index.year).pct_change().add(1)
 .groupby(df.index.year).cumprod().sub(1)
 .resample('YE').last().T
)
BTC-USD (Bitcoin) shows missing values in the early years due to its regulation and adoption (see the full story on Wikipedia).
Column summary
How did the assets perform over the years?
We calculate the average annual return and the annual cumulative return for each asset.
For more details on the calculation of returns, visit this tutorial.
t_avg = df.mean(axis=1).mul(100)
t_cum = df.add(1).cumprod(axis=1).sub(1).mul(100).iloc[:,[-1]]

pd.DataFrame({'AVG': t_avg, 'CAGR': t_cum})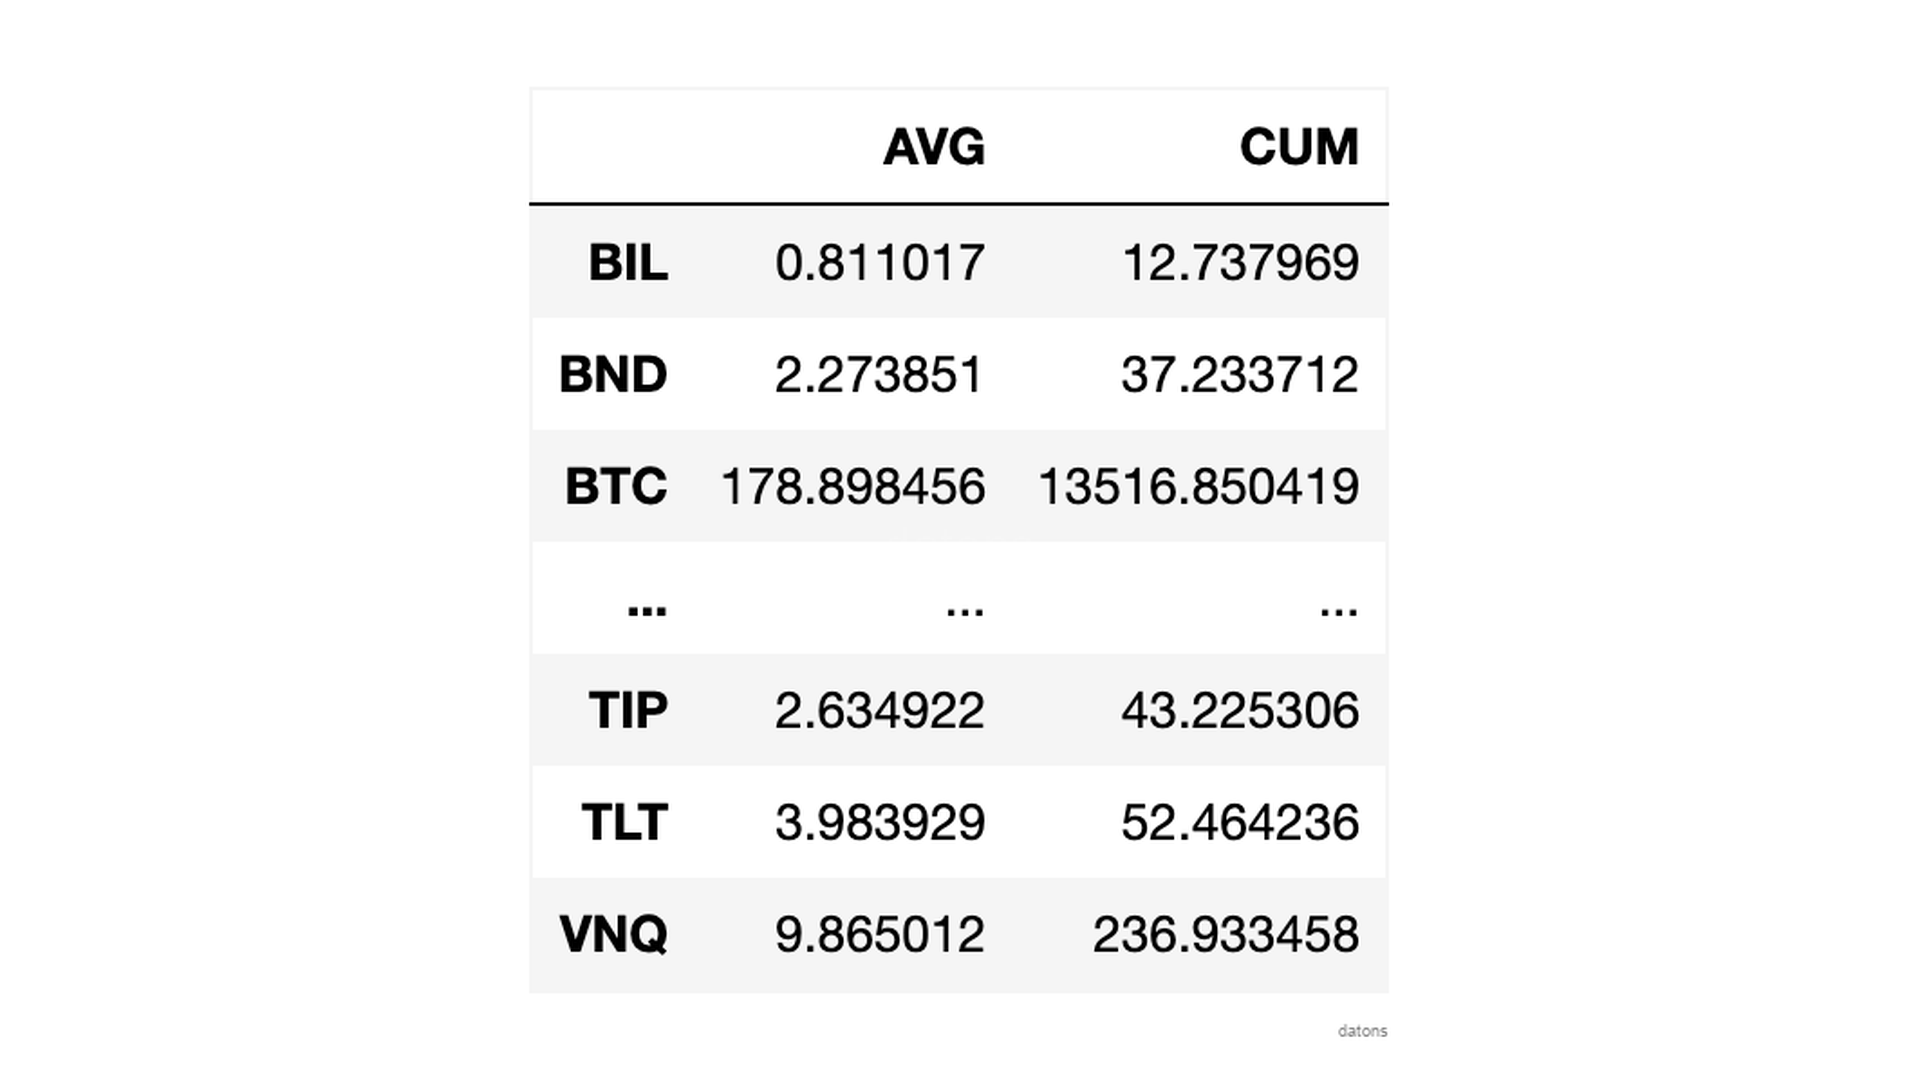
Row summary
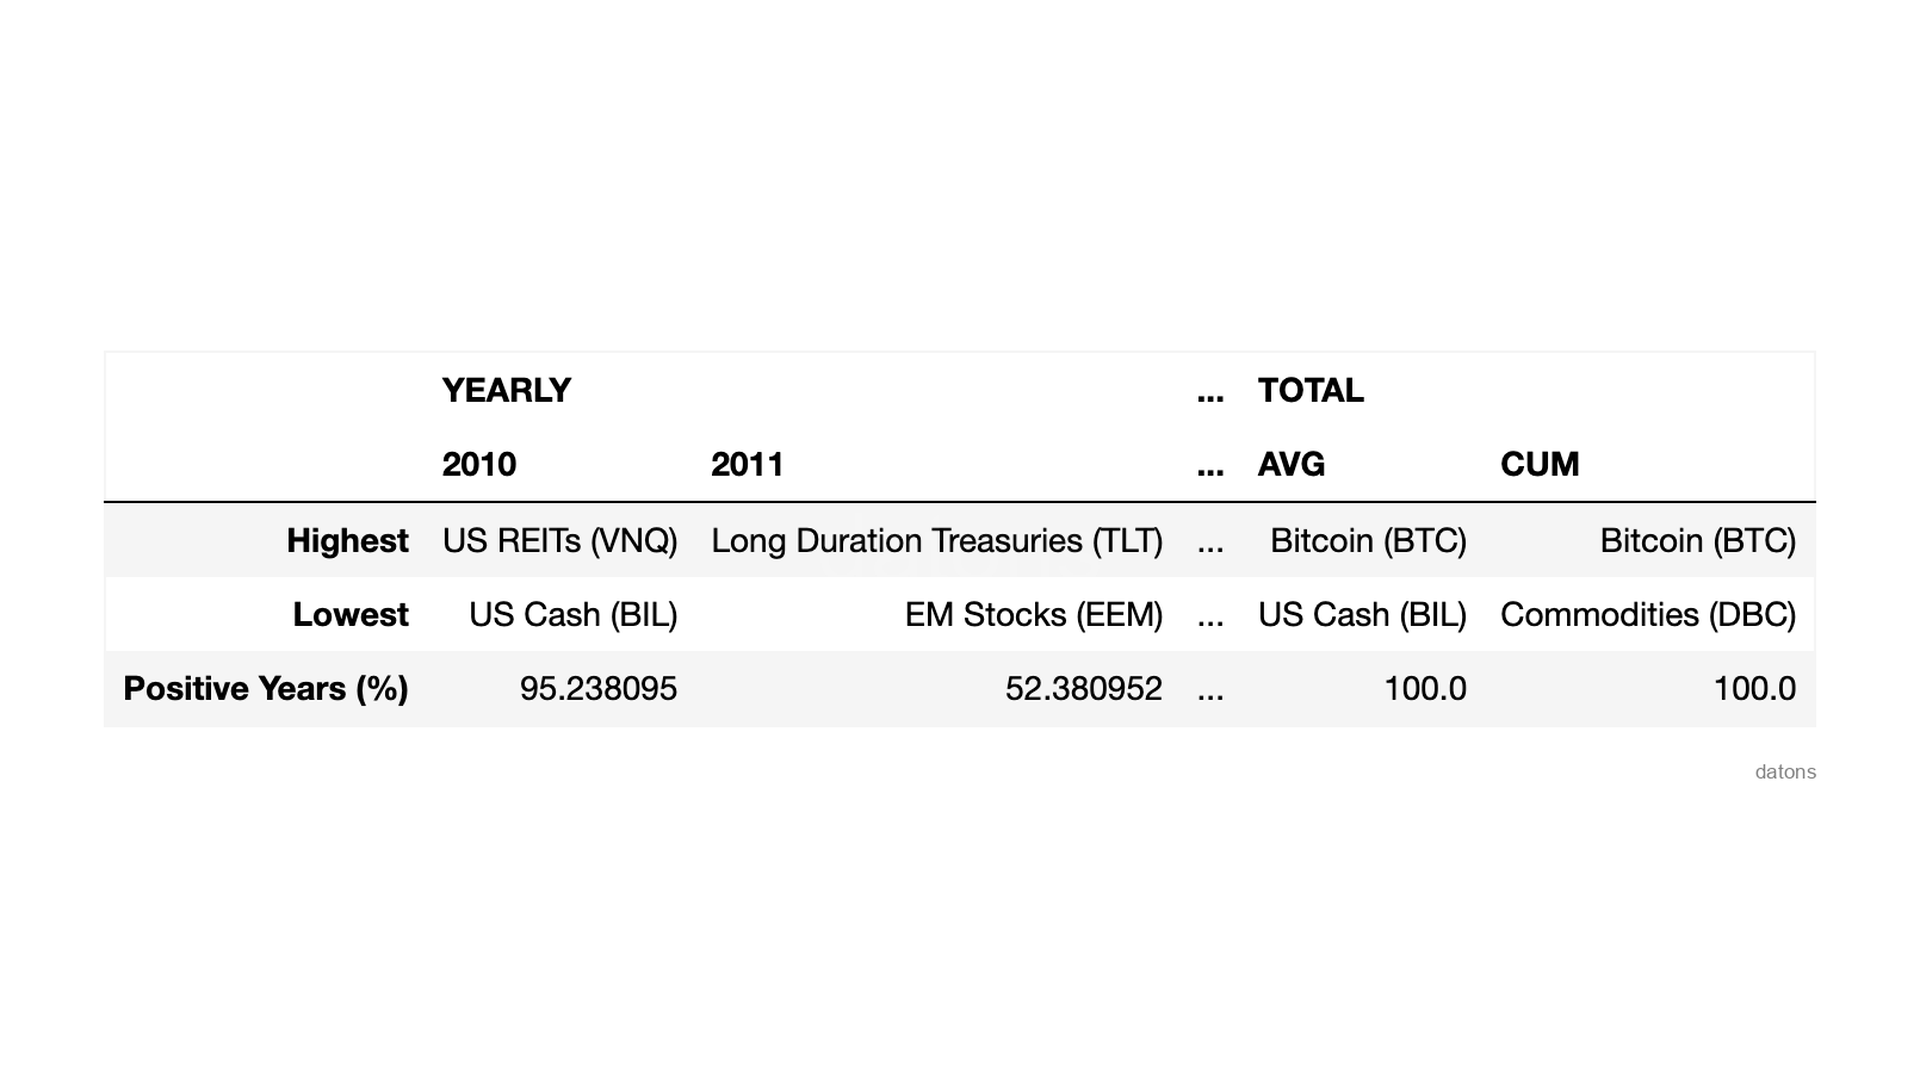
What were the maximum and minimum values each year? What was the percentage of positive returns?
positive_pct = lambda x: (x > 0).mean() * 100
dfr.agg(['max', 'min', positive_pct])
All assets showed positive cumulative returns at the end of the period, with BTC-USD being the most profitable asset.
Combining and styling
Finally, we combine all tables and apply styling to highlight maximum and minimum values.
This tutorial explains how to apply styles to pandas tables to create a heat matrix this tutorial.
Why did almost all assets show negative returns in 2022?
Looking forward to your comments.
Conclusions
- Downloading historical data:
yf.download(tickers)to get data for multiple financial assets from Yahoo Finance. - Calculating annual cumulative return:
.pct_change().add(1).cumprod().sub(1)to determine an asset’s performance over time. - Grouping data for cumulative calculations:
groupby.cumprodto reset cumulative calculations at the start of each year. - Selecting the last day of cumulative return:
.resample('Y').last()to find the final value of each year, useful for annual analysis. - Identifying maximum and minimum values:
.agg(['max', 'min'])to discover the extremes in annual asset performance. - Calculating the percentage of positive returns:
lambda x: (x > 0).mean() * 100to evaluate the frequency of an asset’s gains.
In addition to this tutorial, you can learn more with our live courses.
I’ll teach you the best practices for writing more efficient code in fewer lines and address your questions, all while working on practical cases with data that interests you.
For more info, visit datons
Keep reading
Related articles you might enjoy
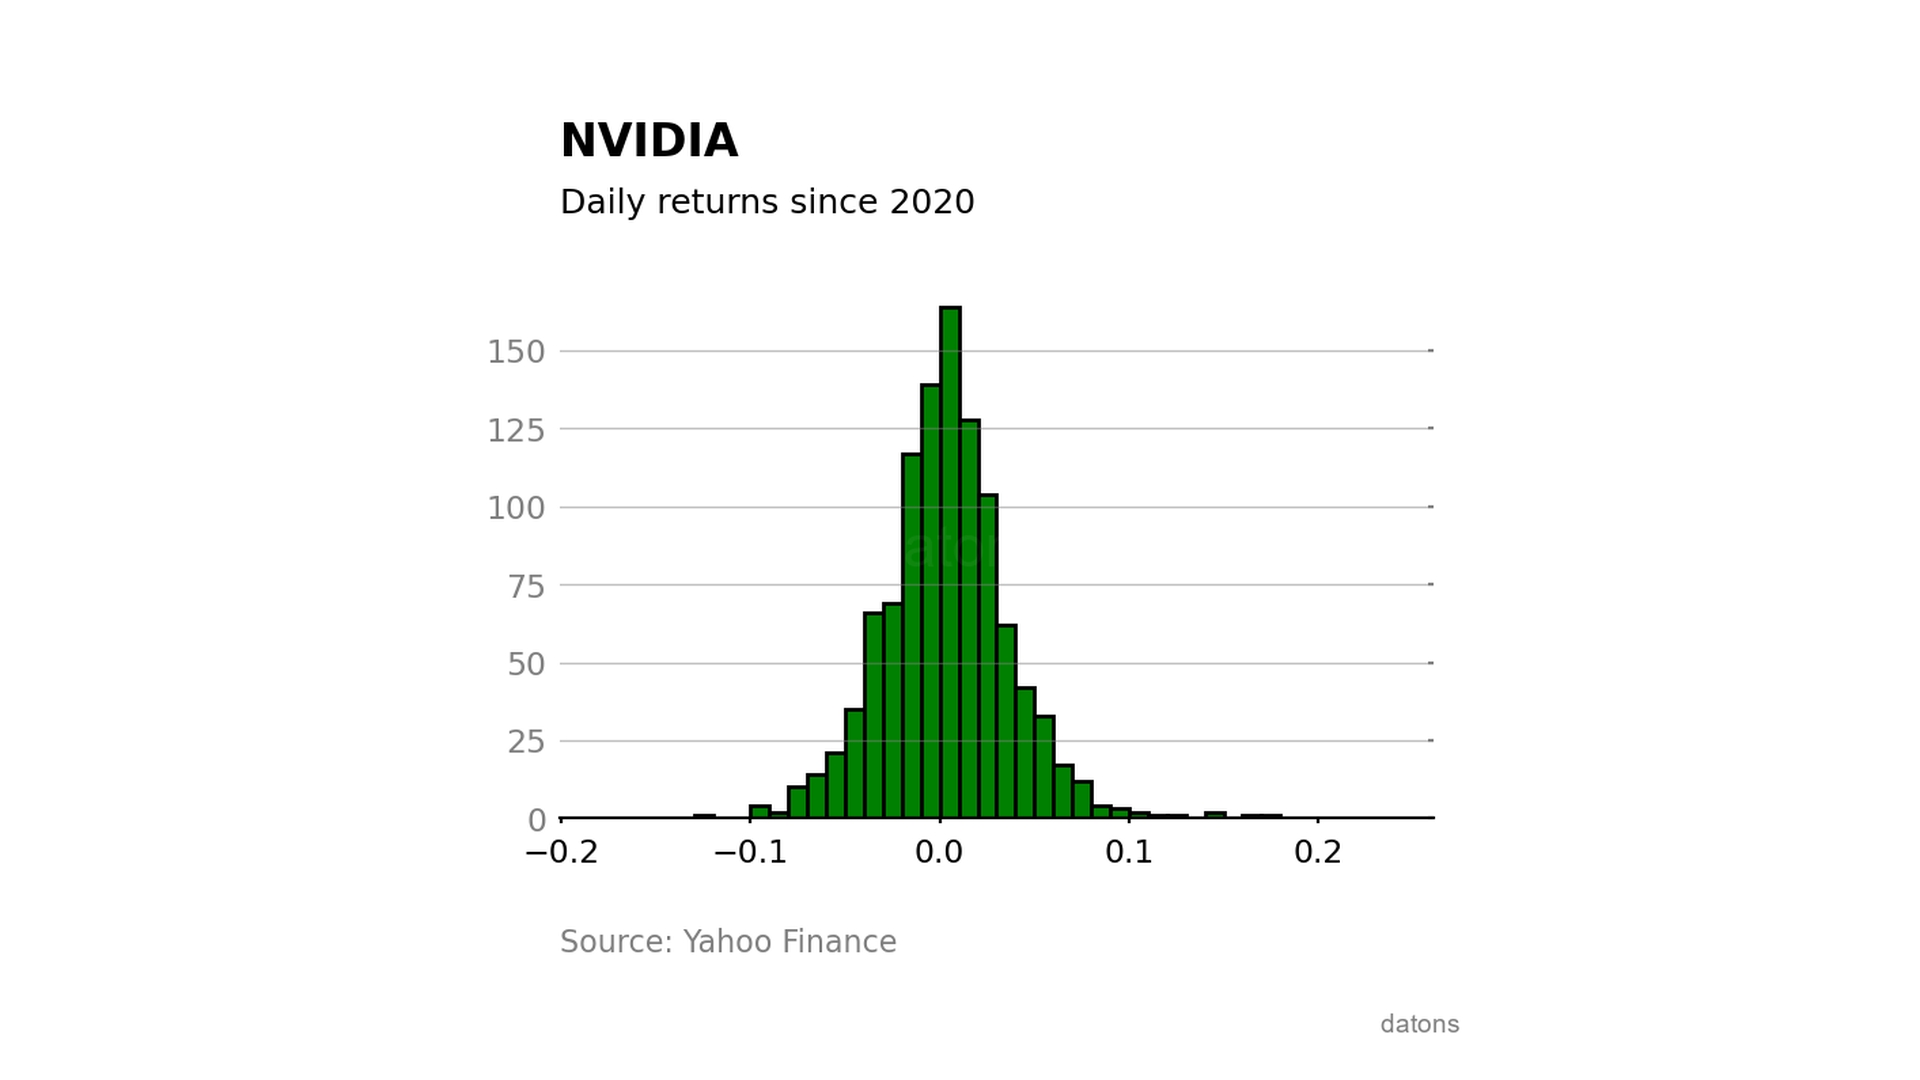
Preprocess and analyze stock returns with Python
Learn to statistically analyze the stock performance of a company with Python.
Read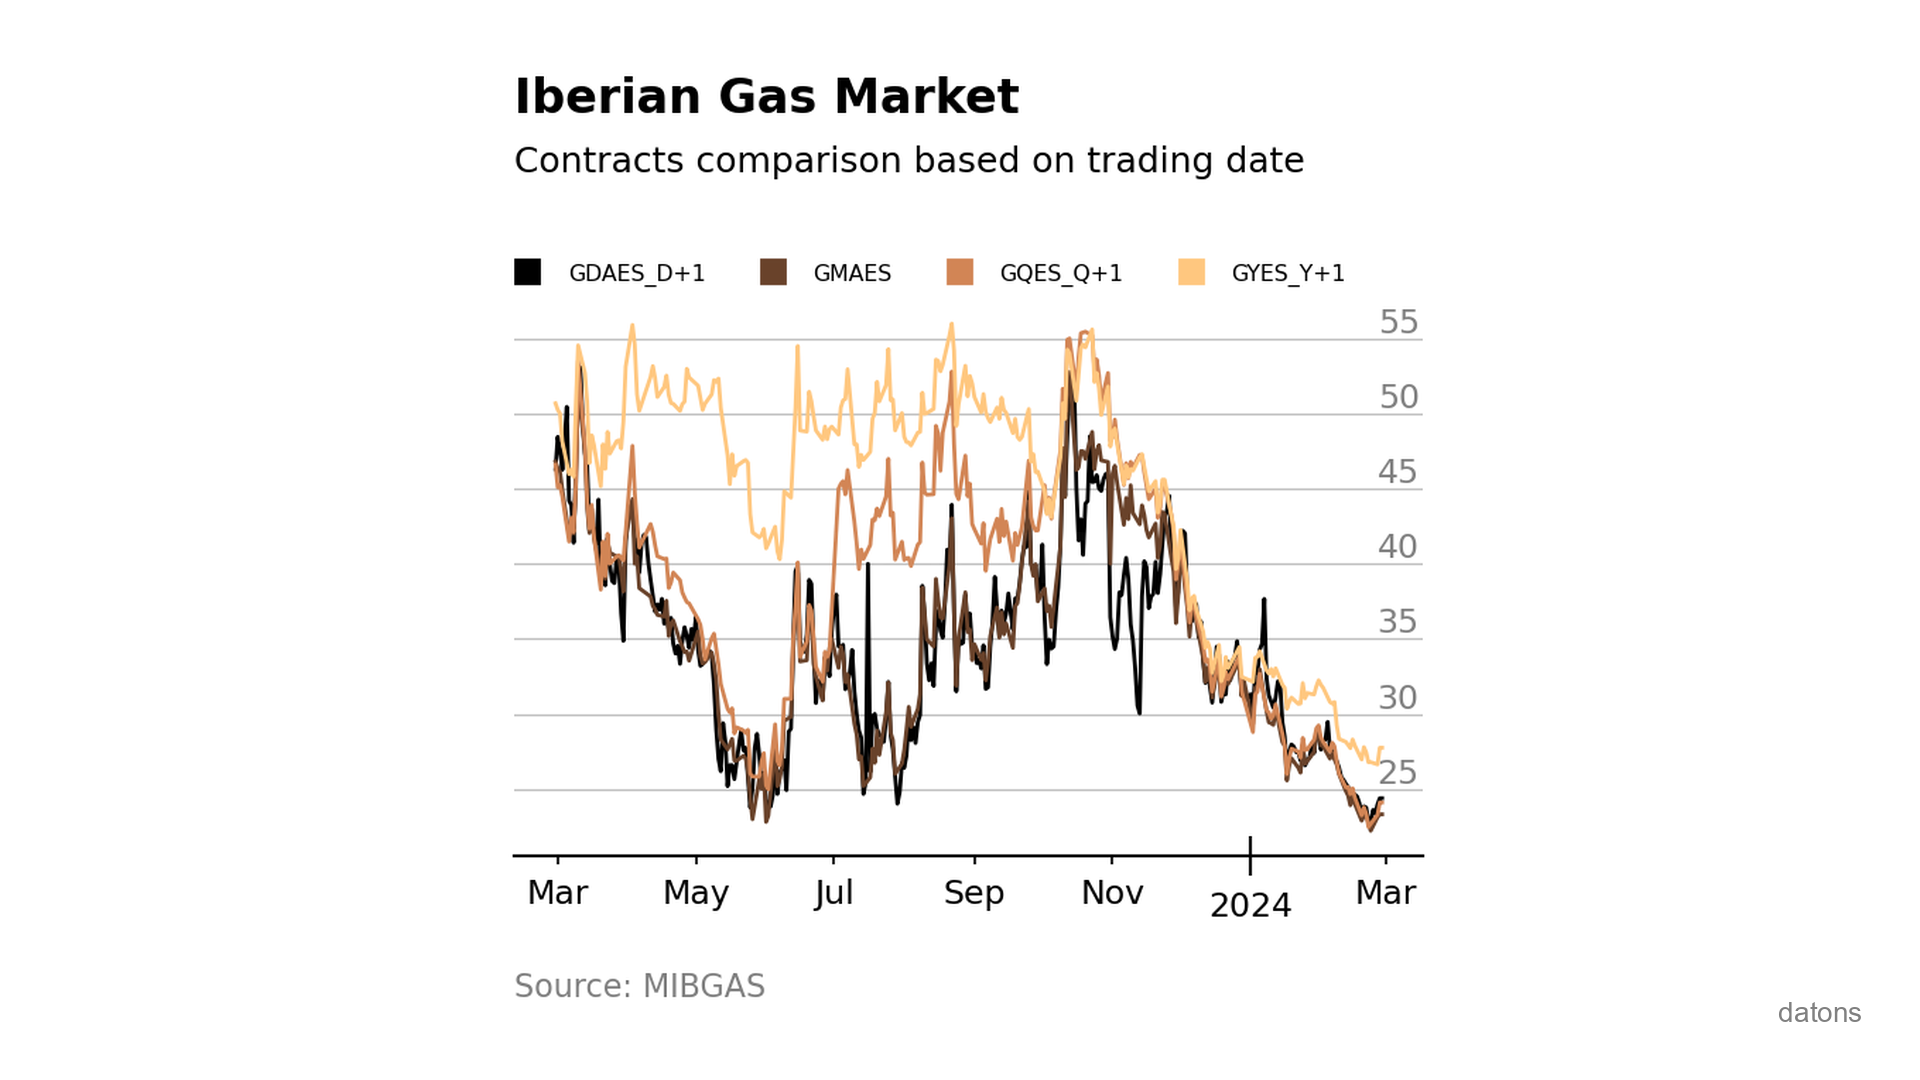
Visually comparing contracts from Iberian gas market MIBGAS
Discover how to analyze and visualize MIBGAS contract prices using Pandas and Matplotlib. This tutorial guides you through data filtering, date handling, and interpolation techniques.
Read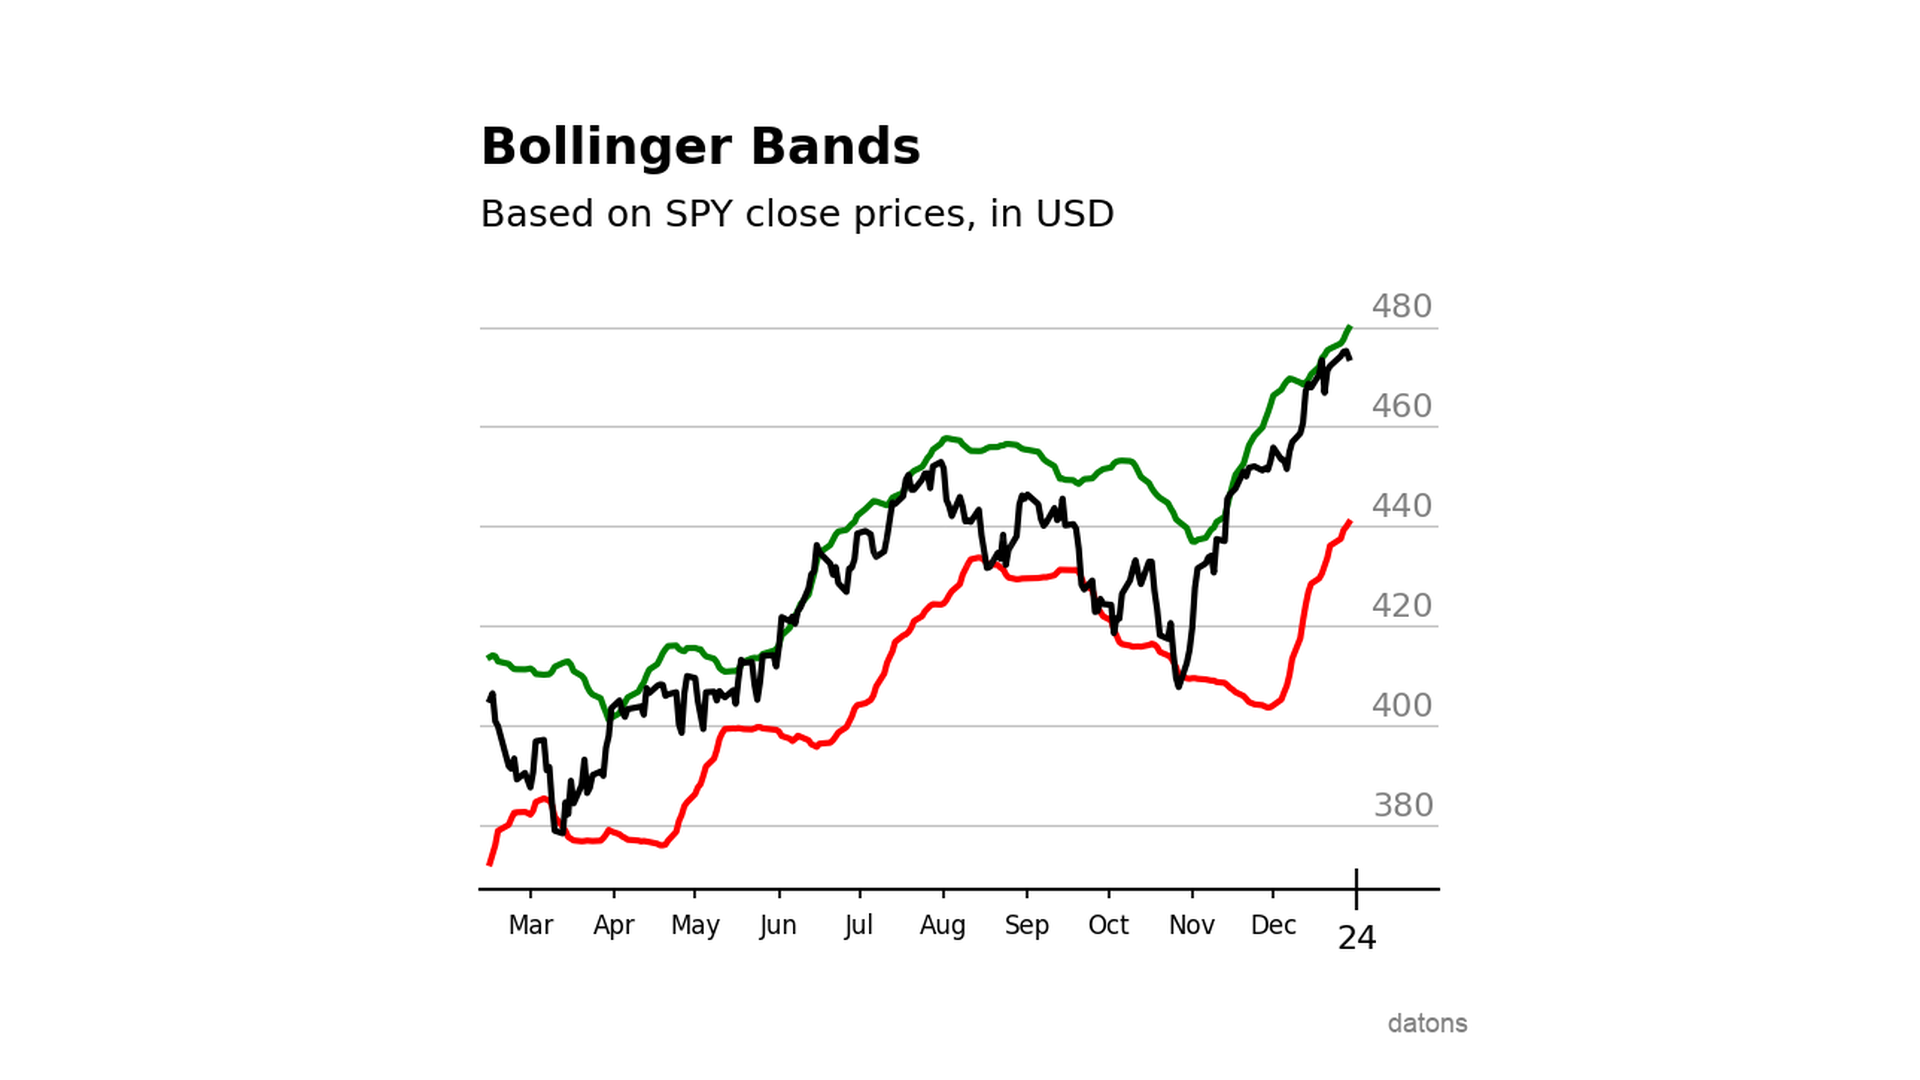
Bollinger Bands with Python applied to the S&P500
Using Bollinger Bands, we can create a trading strategy to buy and sell stocks based on the market's moving volatility.
Read