
With the global transition towards renewable energy and the pressing need to reduce carbon emissions, understanding the energy capacities and the mix of technologies in play is crucial.
Spain, with its varied landscape, offers an excellent opportunity to study the balance between renewable and non-renewable energy sources. This article dives deep into the installed power capacity of various energy technologies in Spain, analyzing the potential, demand, and efficiency of each.
Data
Each row of the following dataset represents the energy (electricity) that different technologies, such as Hydroelectric, Combined Cycle, and Nuclear, generate per hour in one year.
The data is provided by Red Eléctrica de España (REE), Spain’s Grid Operator, via ESIOS API. Learn how to download the data automatically with this video.

Questions
- How has Spain’s energy mix evolved over the past decade?
- What percentage of Spain’s energy comes from renewable sources?
- Are renewable energies capable of meeting Spain’s energy demand on their own?
- What challenges do renewable energies pose in terms of reliability and consistency?
- Which energy technology makes the most efficient use of its installed capacity?
Analysis
Installed power capacity
How much electricity could Spain generate during any given hour?
Spain has an installed power capacity of 119 GWh, according to the official grid operator Red Eléctrica España (REE).
61% of energy comes from renewable sources such as wind and photovoltaic solar.

Hourly energy demand
Nevertheless, Spain doesn’t need 119 GWh in any hour; the minimum and maximum electricity demand for any given hour is 16 and 44 GWh, respectively, with an average of 30.
For the following explanations, 30 GWh will be the baseline reference for any given hour.

Energy generation by technology
Based on installed power capacity, wind (29 GWh) could generate the demand of a complete hour without any other technology involved.
Unfortunately, since the wind does not always blow, wind energy cannot have exclusivity; more energy sources are required, both renewable and non-renewable.
Why is it not enough to rely on renewable energy sources?
They are unstable: generating renewable energy sources is not always guaranteed due to climatological conditions.
For example, if the wind stops blowing, the wind energy generation will be zero.
A concrete example: what happens if a photovoltaic solar plant in Seville is expected to generate 1 GWh in the next hour, and some clouds suddenly make it impossible? Which energy source could be the alternative?
Combined cycle (26 GWh) is a viable option because it generates electricity from gas. This gas-based generation provides a consistent and dispatchable power source, ensuring the grid always has available electricity without risking oversupply or undersupply.
In conclusion, renewable and non-renewable energy sources must dance with one another to guarantee the grid’s stability and safety.

Utilization ratio by technology
If all the energy from each technology cannot be used at the same time, which one of them takes more advantage of their installed power capacity?
Based on the ratio of actual energy generated to the maximum potential energy that could be produced in a year, nuclear energy emerges as the most efficient, with a ratio of 0.89.
The maximum potential energy is calculated with the maximum generation of technology per hour and multiplied by the number of days within the sample.

Conclusion
Spain’s current energy landscape reveals a notable mix of renewable and non-renewable energy sources, each contributing distinct advantages and challenges to the power grid.
While renewable sources such as wind energy have substantial installed capacities, their variability based on climatic conditions necessitates a complementary role from non-renewable sources like combined cycle to ensure consistent energy availability.
The data also underscores the importance of nuclear energy in terms of utilization efficiency, given its high ratio of actual to potential energy generation. Such insights highlight the complexity and intricacy of managing a national power grid with diverse energy sources.
Keep reading
Related articles you might enjoy
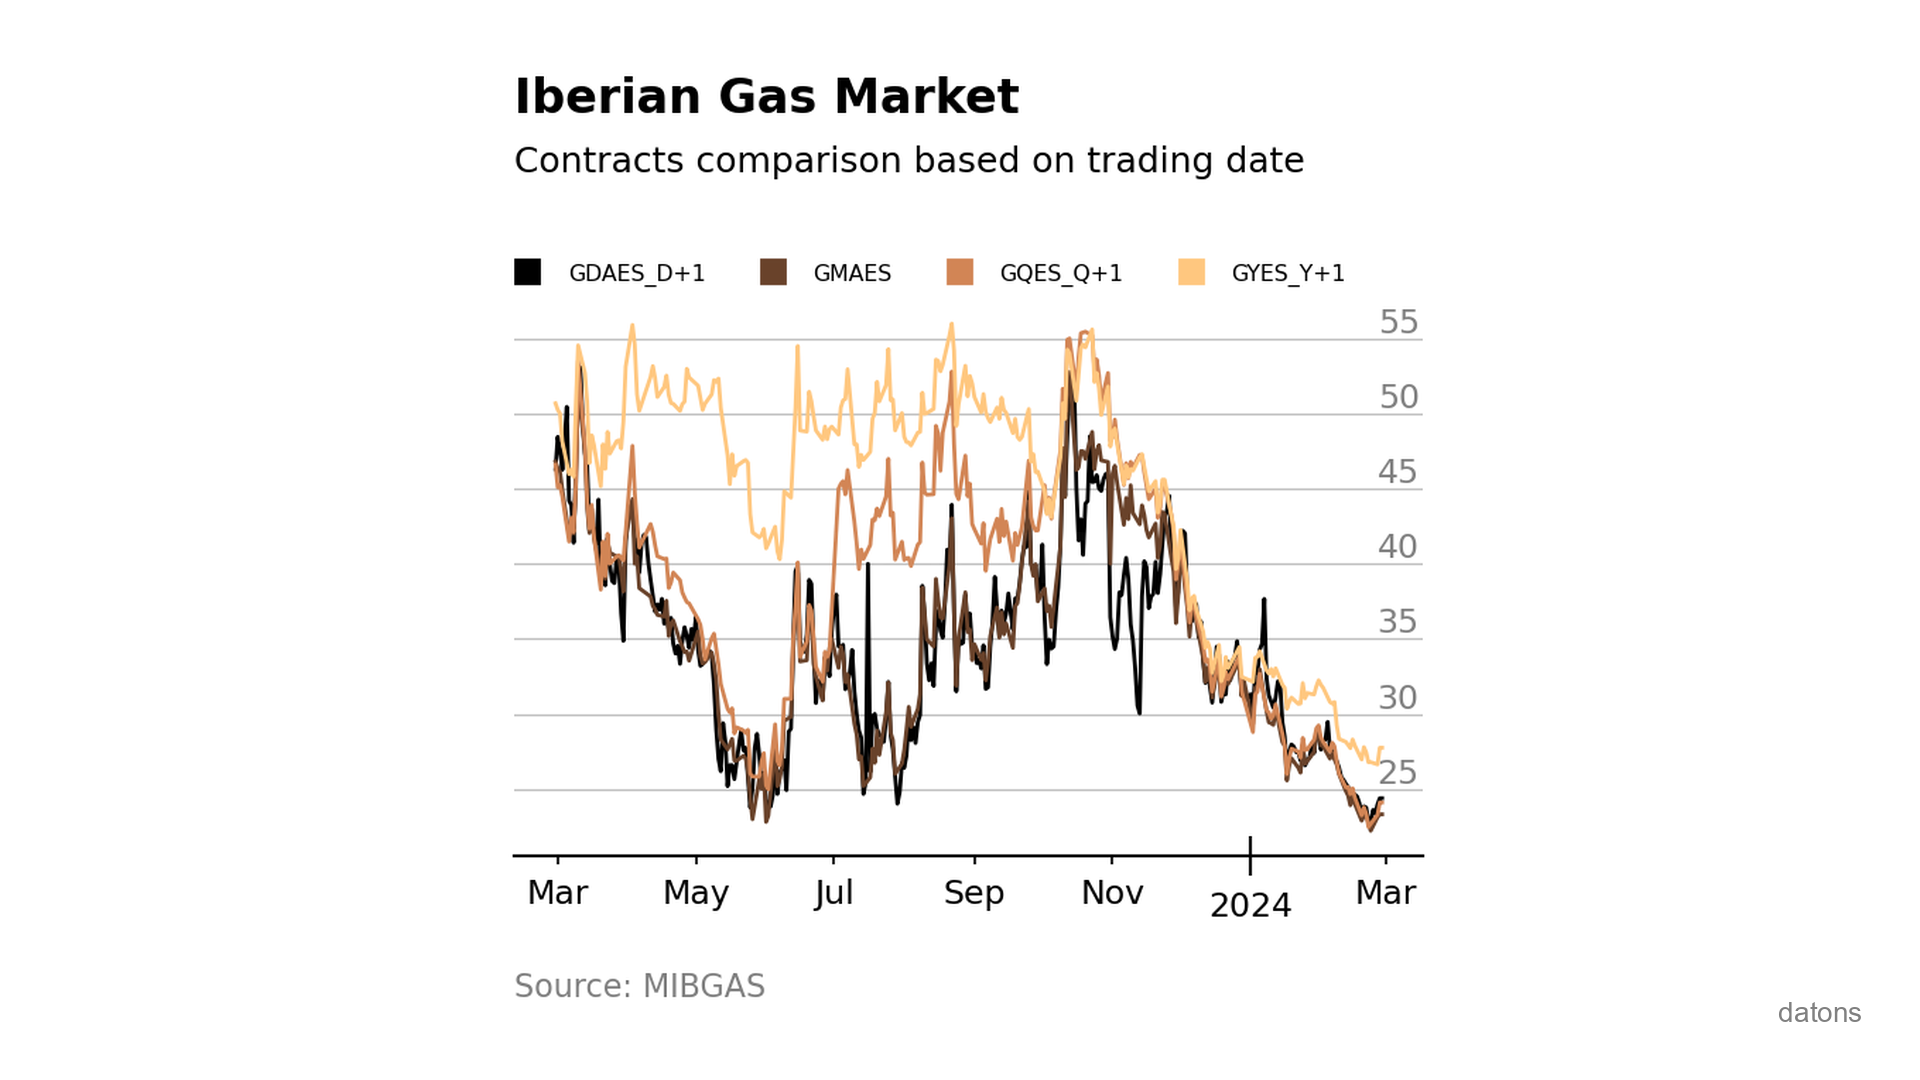
Visually comparing contracts from Iberian gas market MIBGAS
Discover how to analyze and visualize MIBGAS contract prices using Pandas and Matplotlib. This tutorial guides you through data filtering, date handling, and interpolation techniques.
Read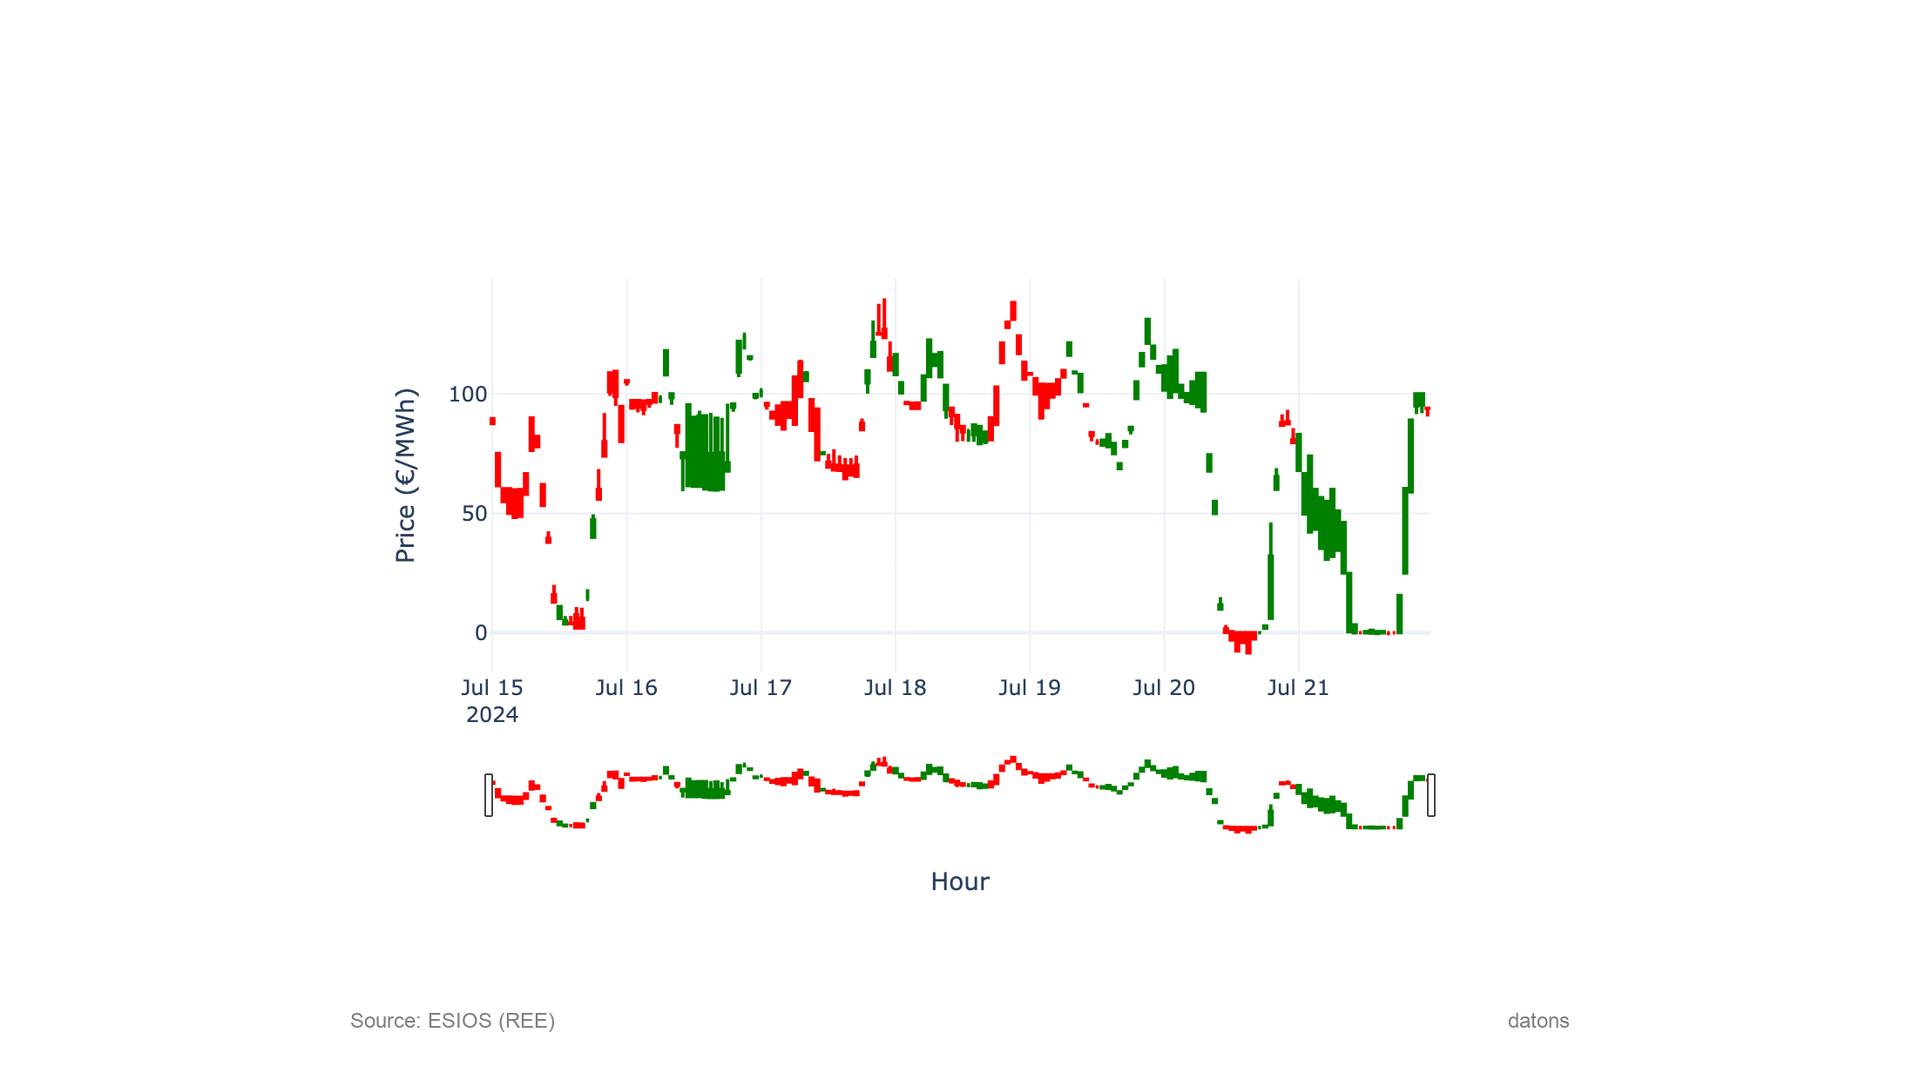
Market price spread
Weekly report (July 15 - July 21, 2024) of the market price spread in OMIE markets.
Read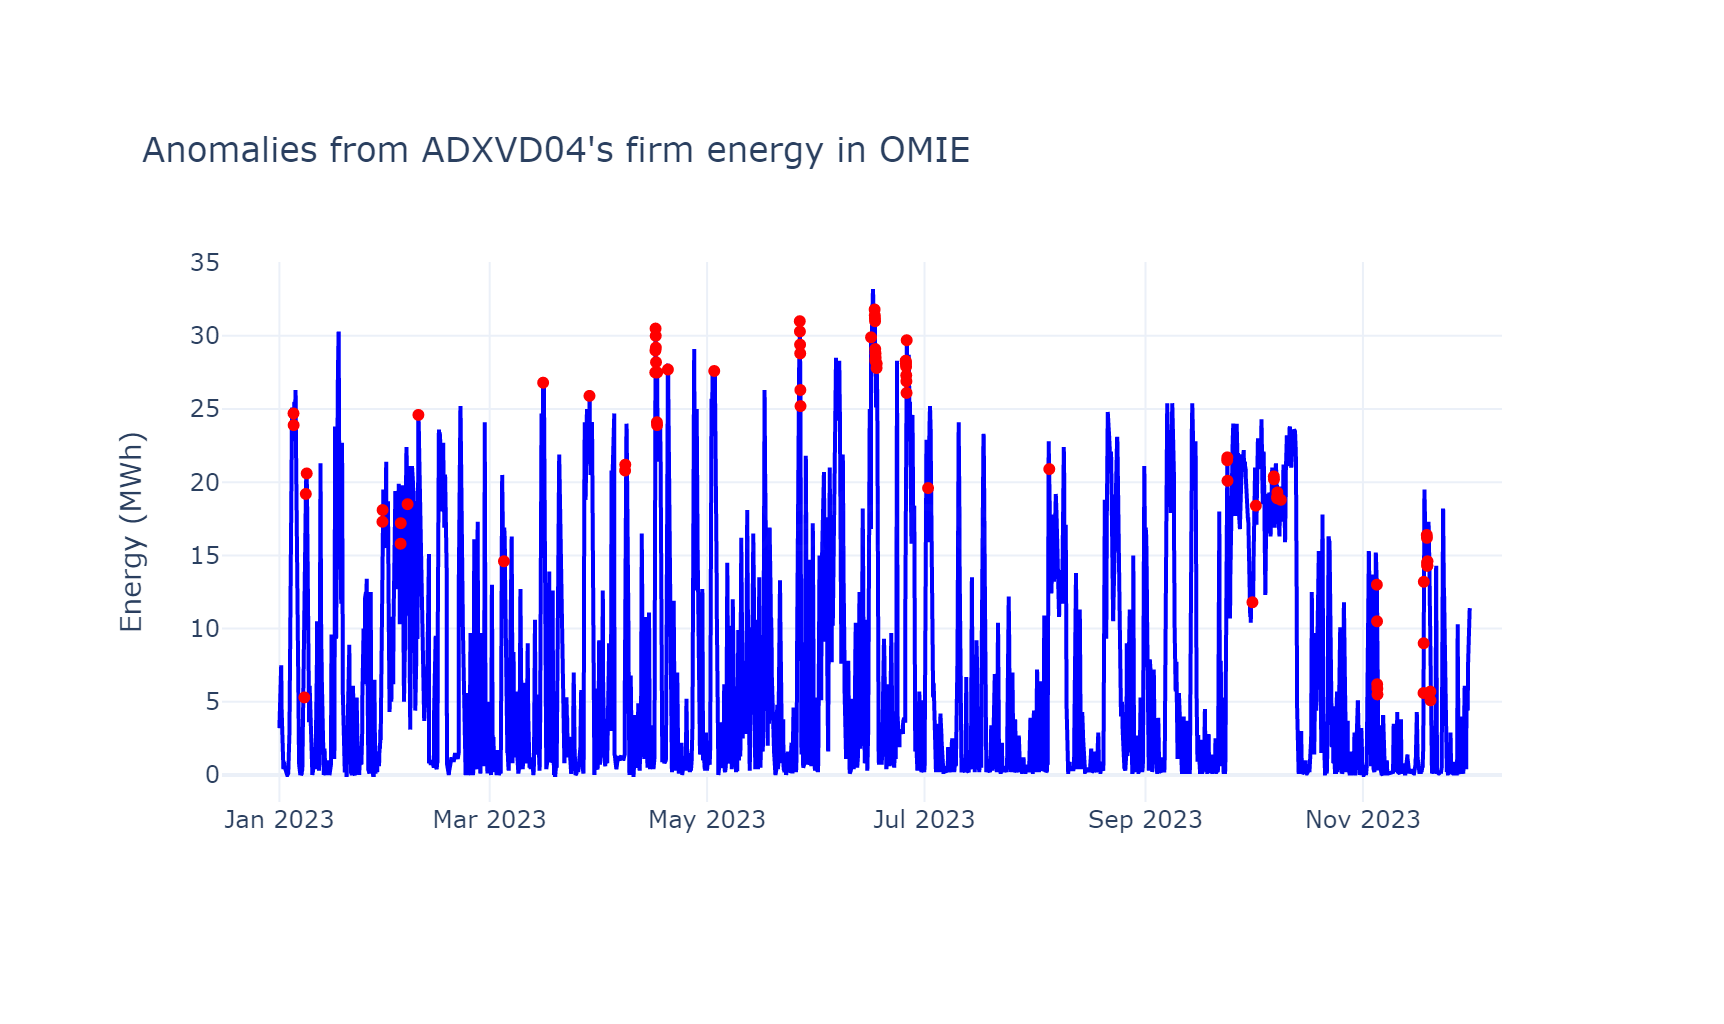
Isolation Forest to detect anomalies in time series data
Learn to detect anomalies in time series with Python, using advanced techniques and Machine Learning algorithms.
Read