
When comparing Spain ES with Italy IT_SACO_AC, we observe that the increase in the hourly price of electricity in Spain takes longer to arrive.
One of the reasons is that solar generation reduces the price of electricity.
Although both countries are in the same time zone, Italy is further east than Spain, so the sun sets earlier in Italy than in Spain.
In this tutorial, we’ll explain how to download European energy data through the ENTSO-E API and analyze it with Python.
Want a simpler approach? We’ve published python-entsoe — a Python library that wraps everything in this tutorial into simple function calls. Read the announcement →
Questions
- How to access the ENTSO-E API to download European energy data?
- Which function is used to download generation data?
- And electricity prices?
- How to use area codes to download data by country?
- How are data grouped to perform hourly comparisons?
- How to download multiple market areas at once?
Methodology
Getting access token
To programmatically download data from ENTSO-E, you need an access token. Since 2024 ENTSO-E no longer exposes the token directly in the account menu — you first have to request API access by email:
- Register on the ENTSO-E Transparency Platform.
- From the email address you registered with, send a message to transparency@entsoe.eu with the subject “Restful API access” asking for API access.
- Wait for their confirmation reply (usually a few business days).
- Once approved, log in and open My Account Settings → Web Api Security Token to generate your token.
API_TOKEN = 'YOUR_TOKEN'To work with the ENTSO-E API in Python, we recommend using python-entsoe, a modern library that provides a cleaner interface and better developer experience. Check out our full tutorial on python-entsoe for more details.
pip install python-entsoefrom entsoe import ENTSOEClient
client = ENTSOEClient()Downloading generation by technology in Italy
To get started, we’re going to download the data on generation by technology in Italy during February 2024.
start = "2024-02-01"
end = "2024-02-29"

df = client.generation.actual(start, end, country="IT")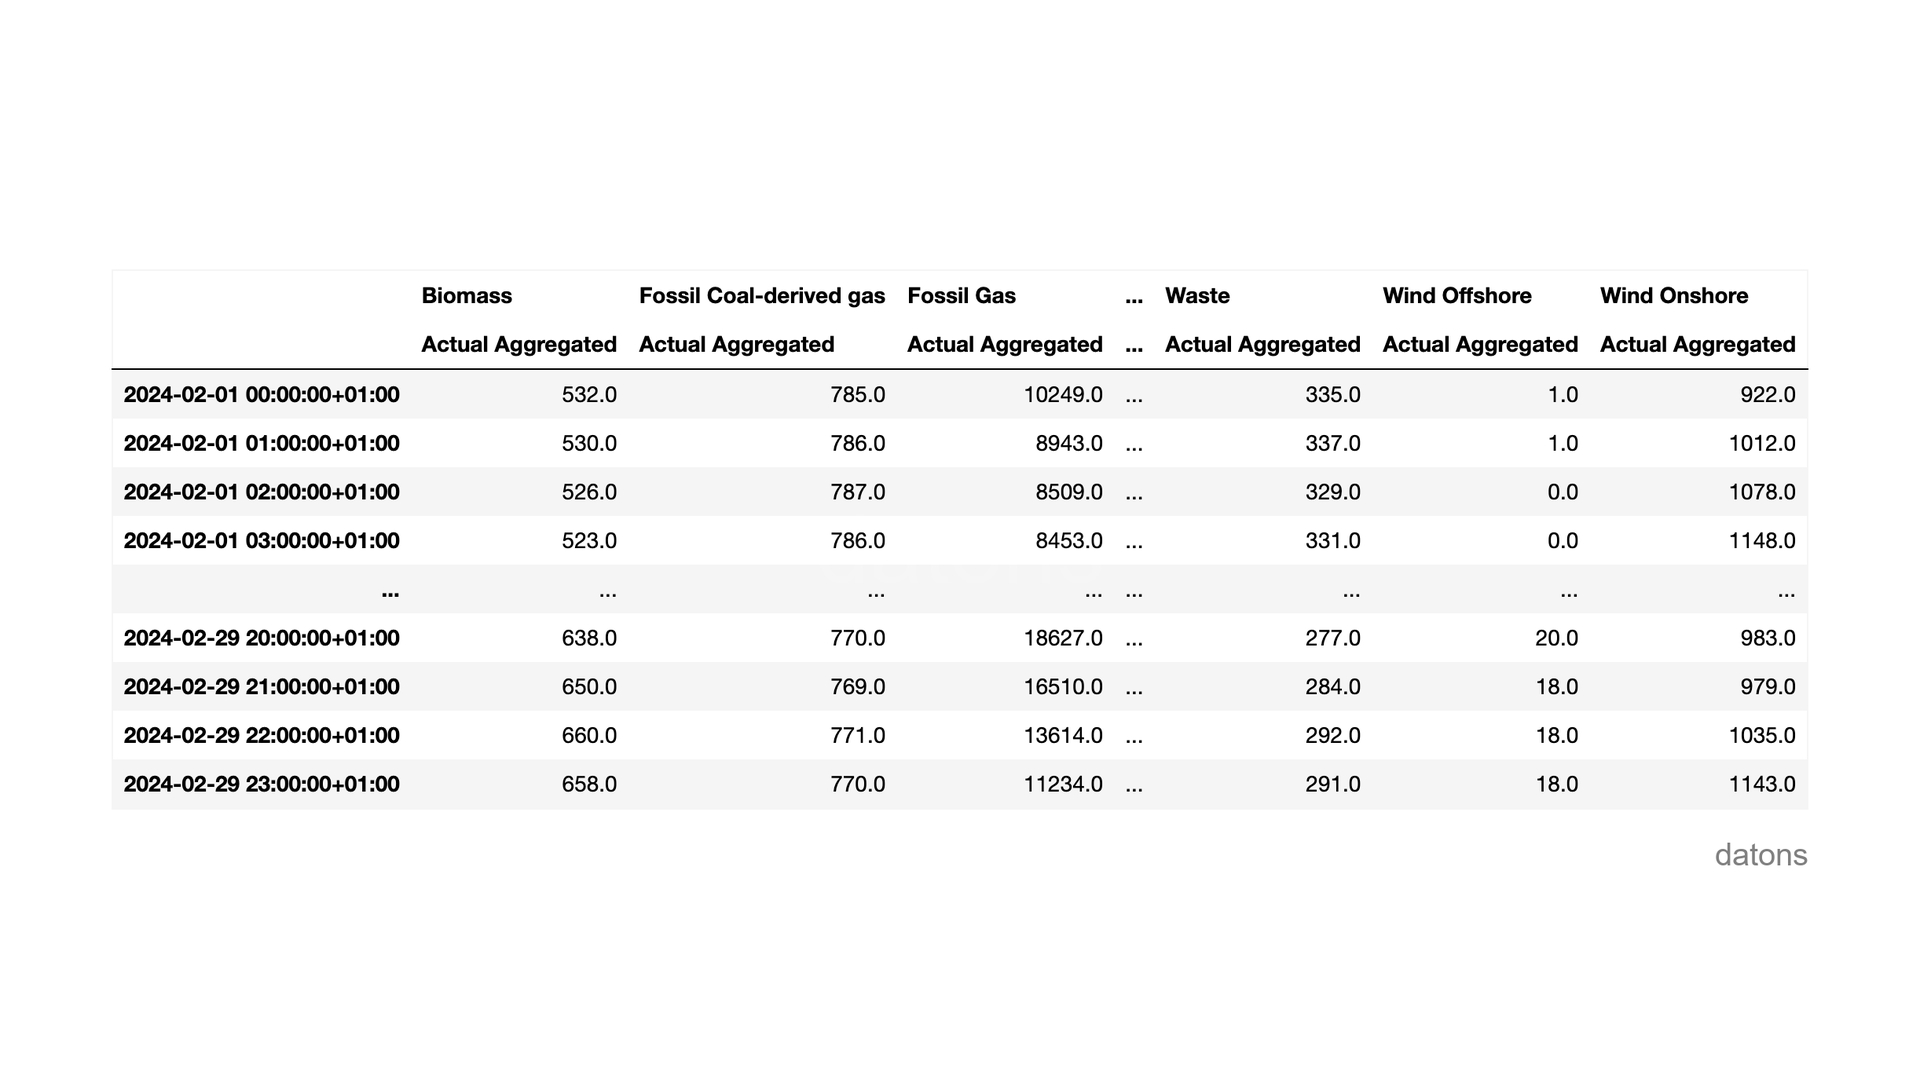
Hourly comparison of generation by technology
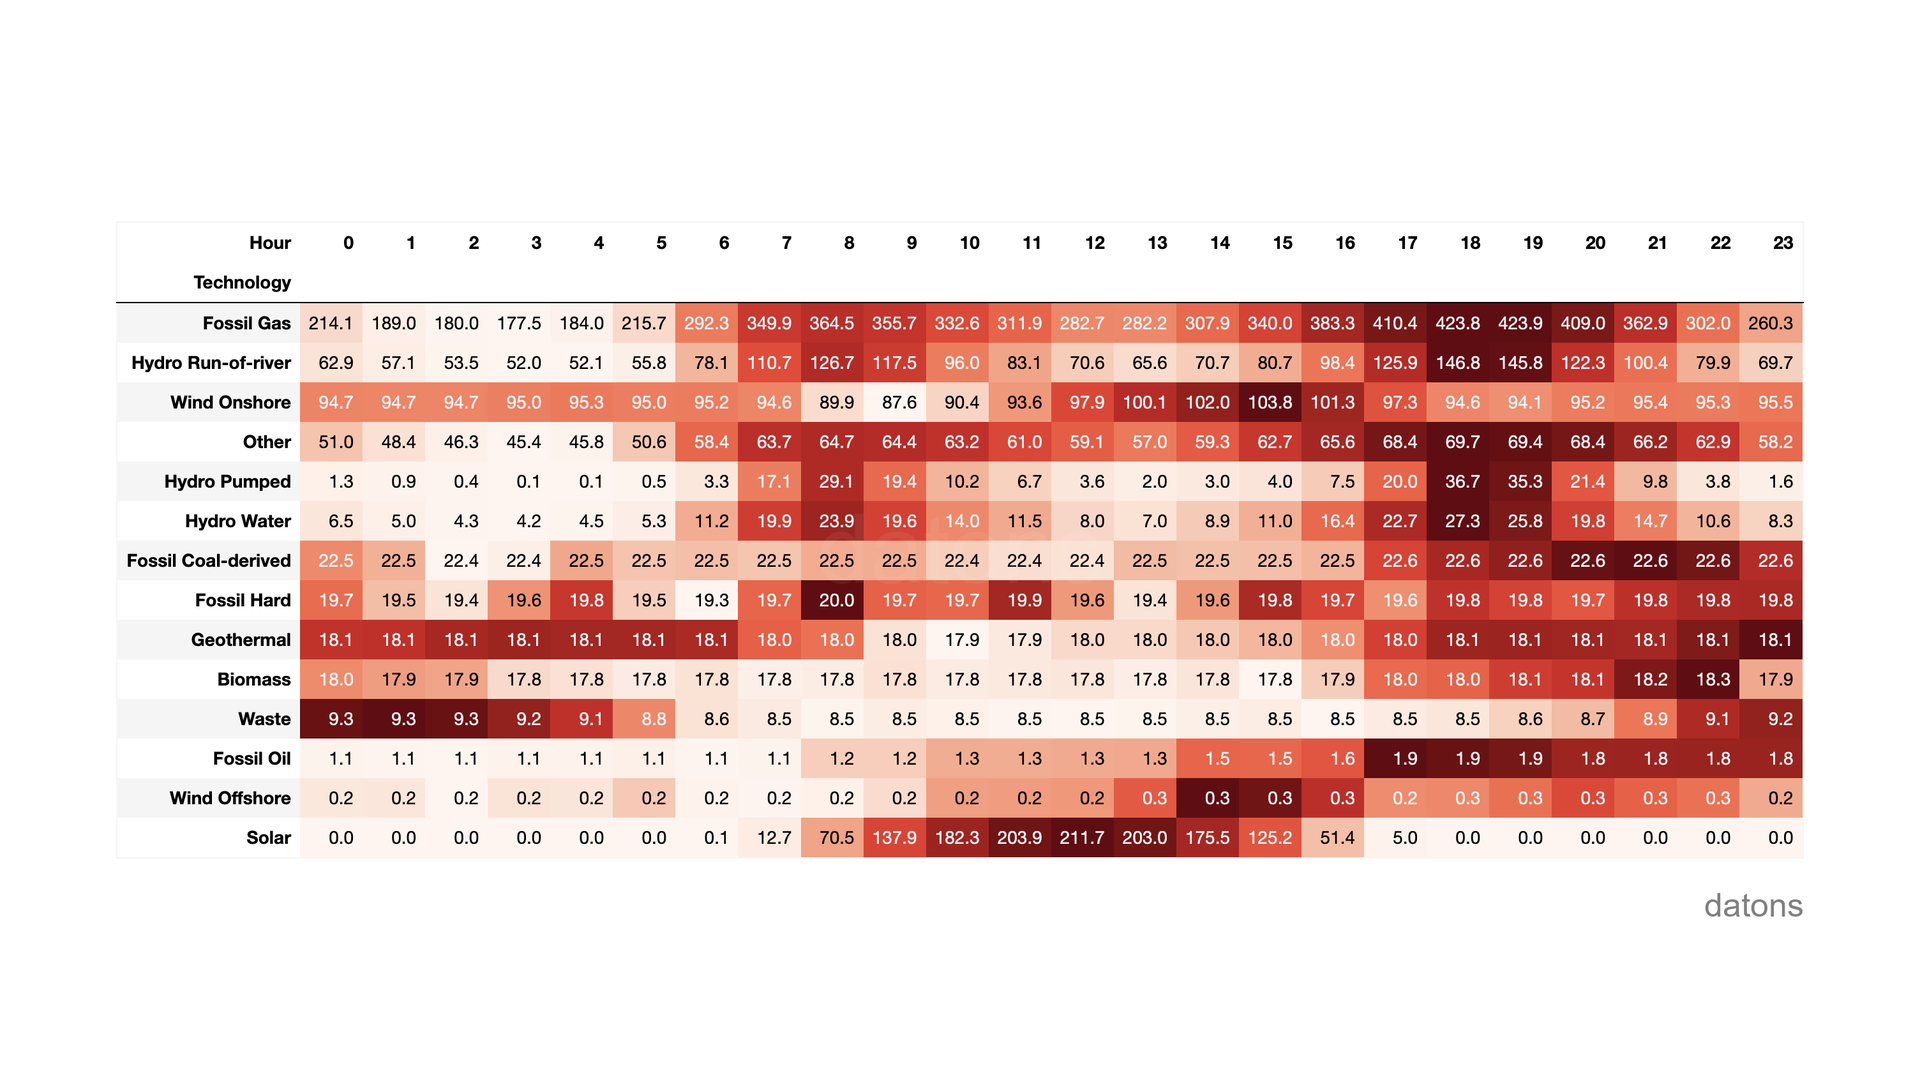
As usual, we’re going to create a heat matrix to highlight the differences in generation by technology in Italy according to the time of day.
df['hour'] = df['timestamp'].dt.hour
df.groupby(['hour']).sum()
Given that there are not many hours of sunlight in February, solar generation was only significant for a few hours, from 9 to 15.
Downloading electricity prices by area in Europe
We’re going to level up: we’ll download the electricity prices by area in Europe.
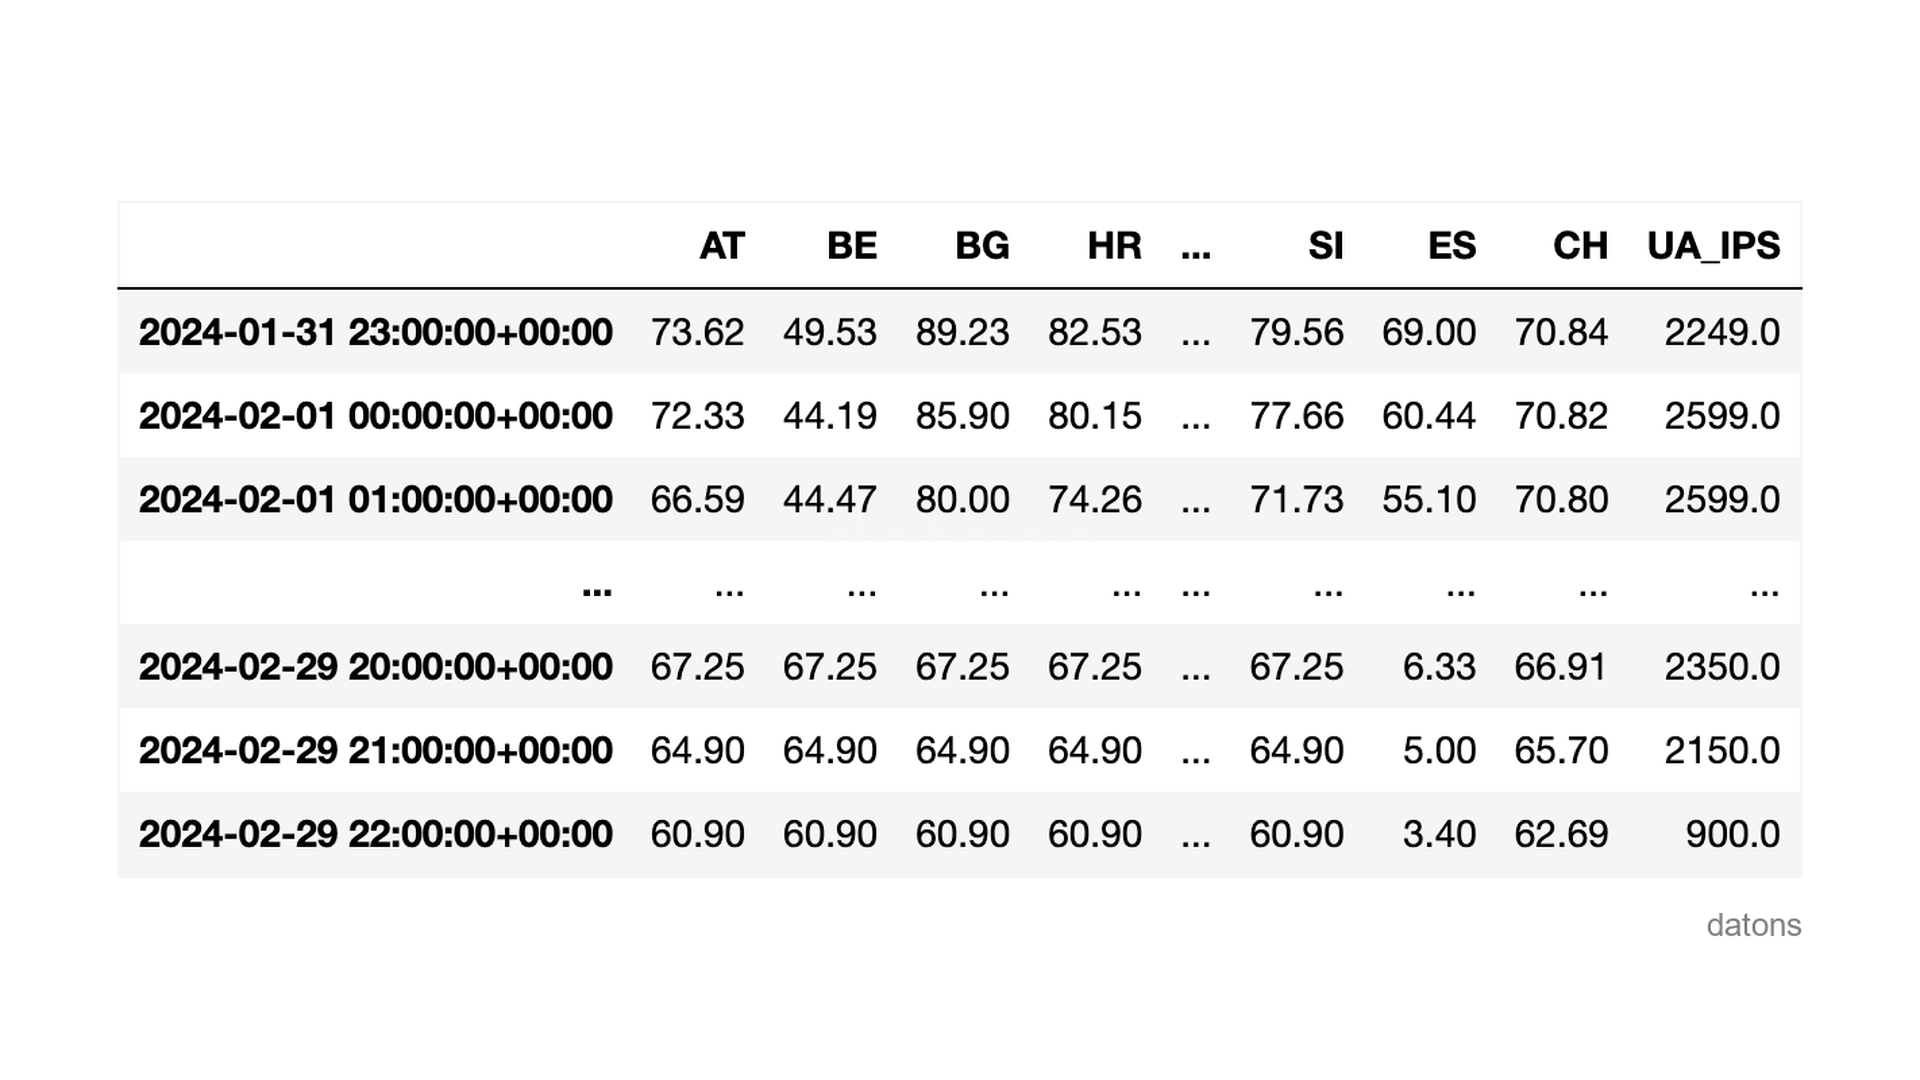
For this, we pass a list of country codes directly — the library handles the iteration and adds a country column automatically.
countries = [
    'AT', 'BE', 'BG', 'HR', 'CZ', 'DE_LU', 'DK_1',
    'EE', 'FI', 'MK', 'FR', 'GR', 'HU', 'IE_SEM',
    'IT_SACO_AC', 'LV', 'LT', 'LU_BZN', 'ME', 'NL', 'NO_1',
    'PL', 'PT', 'RO', 'SE_1', 'RS', 'SK', 'SI',
    'ES', 'CH', 'UA_IPS'
]

df = client.prices.day_ahead(start, end, country=countries)
Hourly comparison of electricity prices
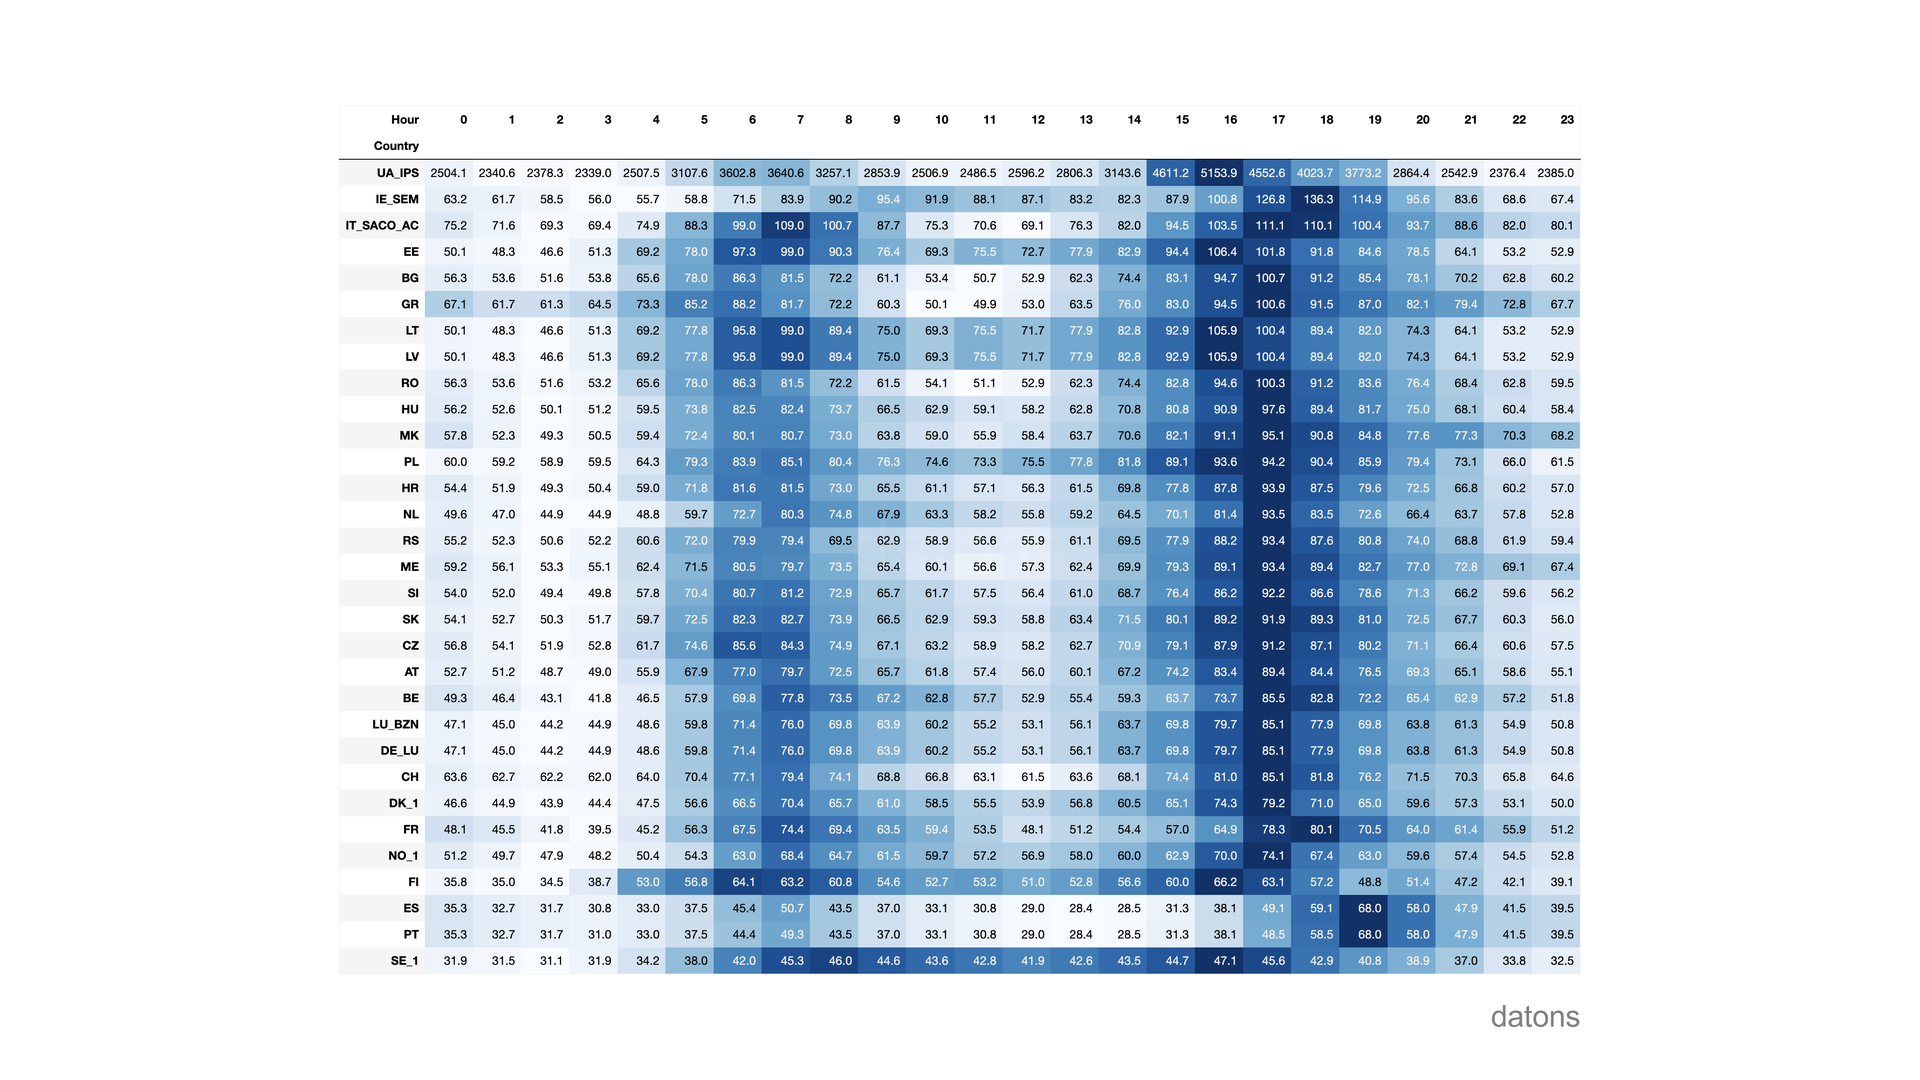
For the price, we calculate the average per hour, which is more representative than the sum (which we had used for generation).
df['hour'] = df['timestamp'].dt.hour
df.groupby(['hour']).mean()
Notice how the price of electricity moves its most expensive range as the sun sets and demand increases, depending on the country.
When comparing Spain ES with Italy IT_SACO_AC, we observe that the price increase in Spain takes longer to arrive because, having the same time zone, Spain is further west.
Want to skip the boilerplate? We’ve packaged these patterns (and more) into python-entsoe, an open-source library that gives you day-ahead prices, generation mix, cross-border flows, and load data in a single function call. pip install python-entsoe and you’re ready.
Conclusions
- Accessing the ENTSO-E API:
ENTSOEClient()frompython-entsoeprovides a clean interface to download data and analyze it withpandas. - Downloading generation data:
client.generation.actual()to download energy generation data by technology from a specific country. - Downloading electricity prices:
client.prices.day_ahead()to get electricity prices for a specific market area. - Using area codes for country data:
countryparameter to specify the market area from which we want to download the data. - Grouping data for hourly comparisons: extracting the hour from timestamps and using
groupbyto aggregate values applying a mathematical function. - Downloading multiple market areas:
pd.concatto concatenate multiple indicators downloaded after iterating over a list of area codes.
Keep reading
Related articles you might enjoy
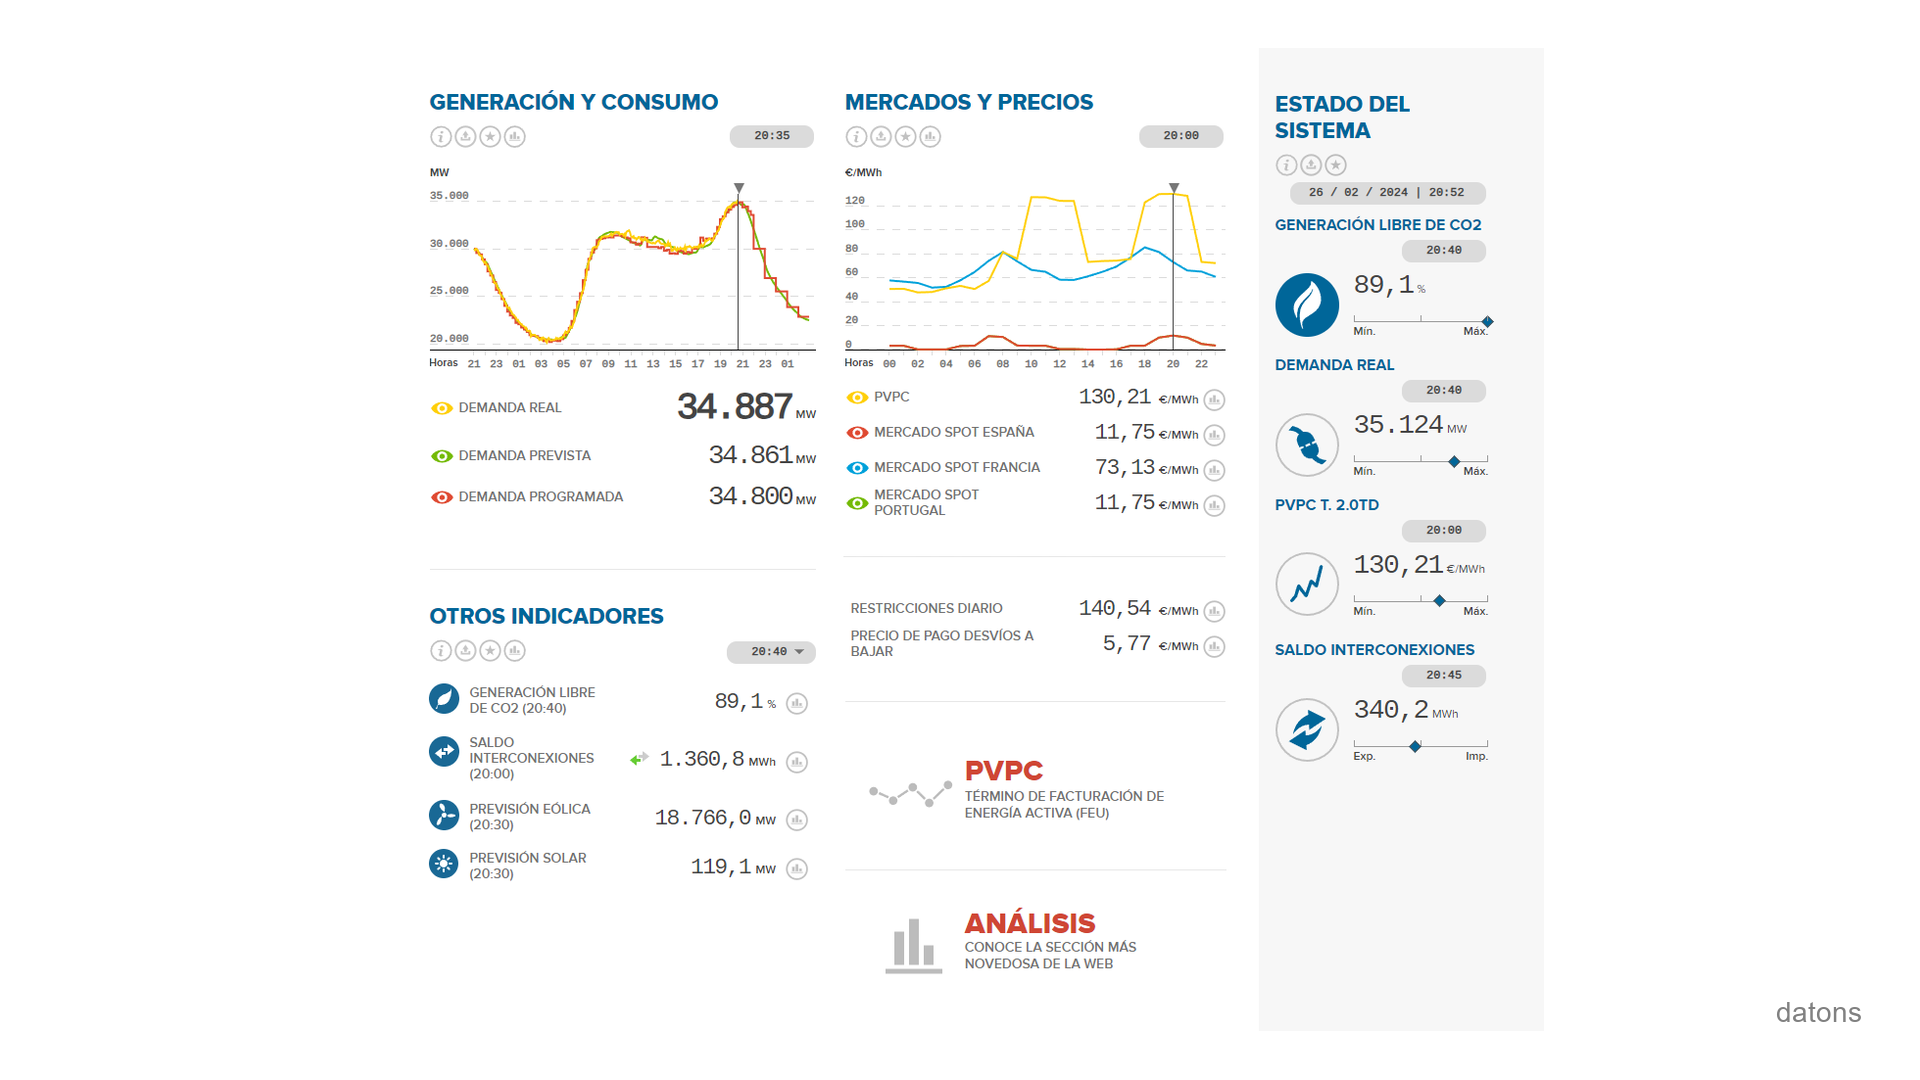
ESIOS API in Python: Spain energy data analysis
Step by step, you'll learn how to download, preprocess, and visualize data from the Spanish Electric Grid's API using Python.
Read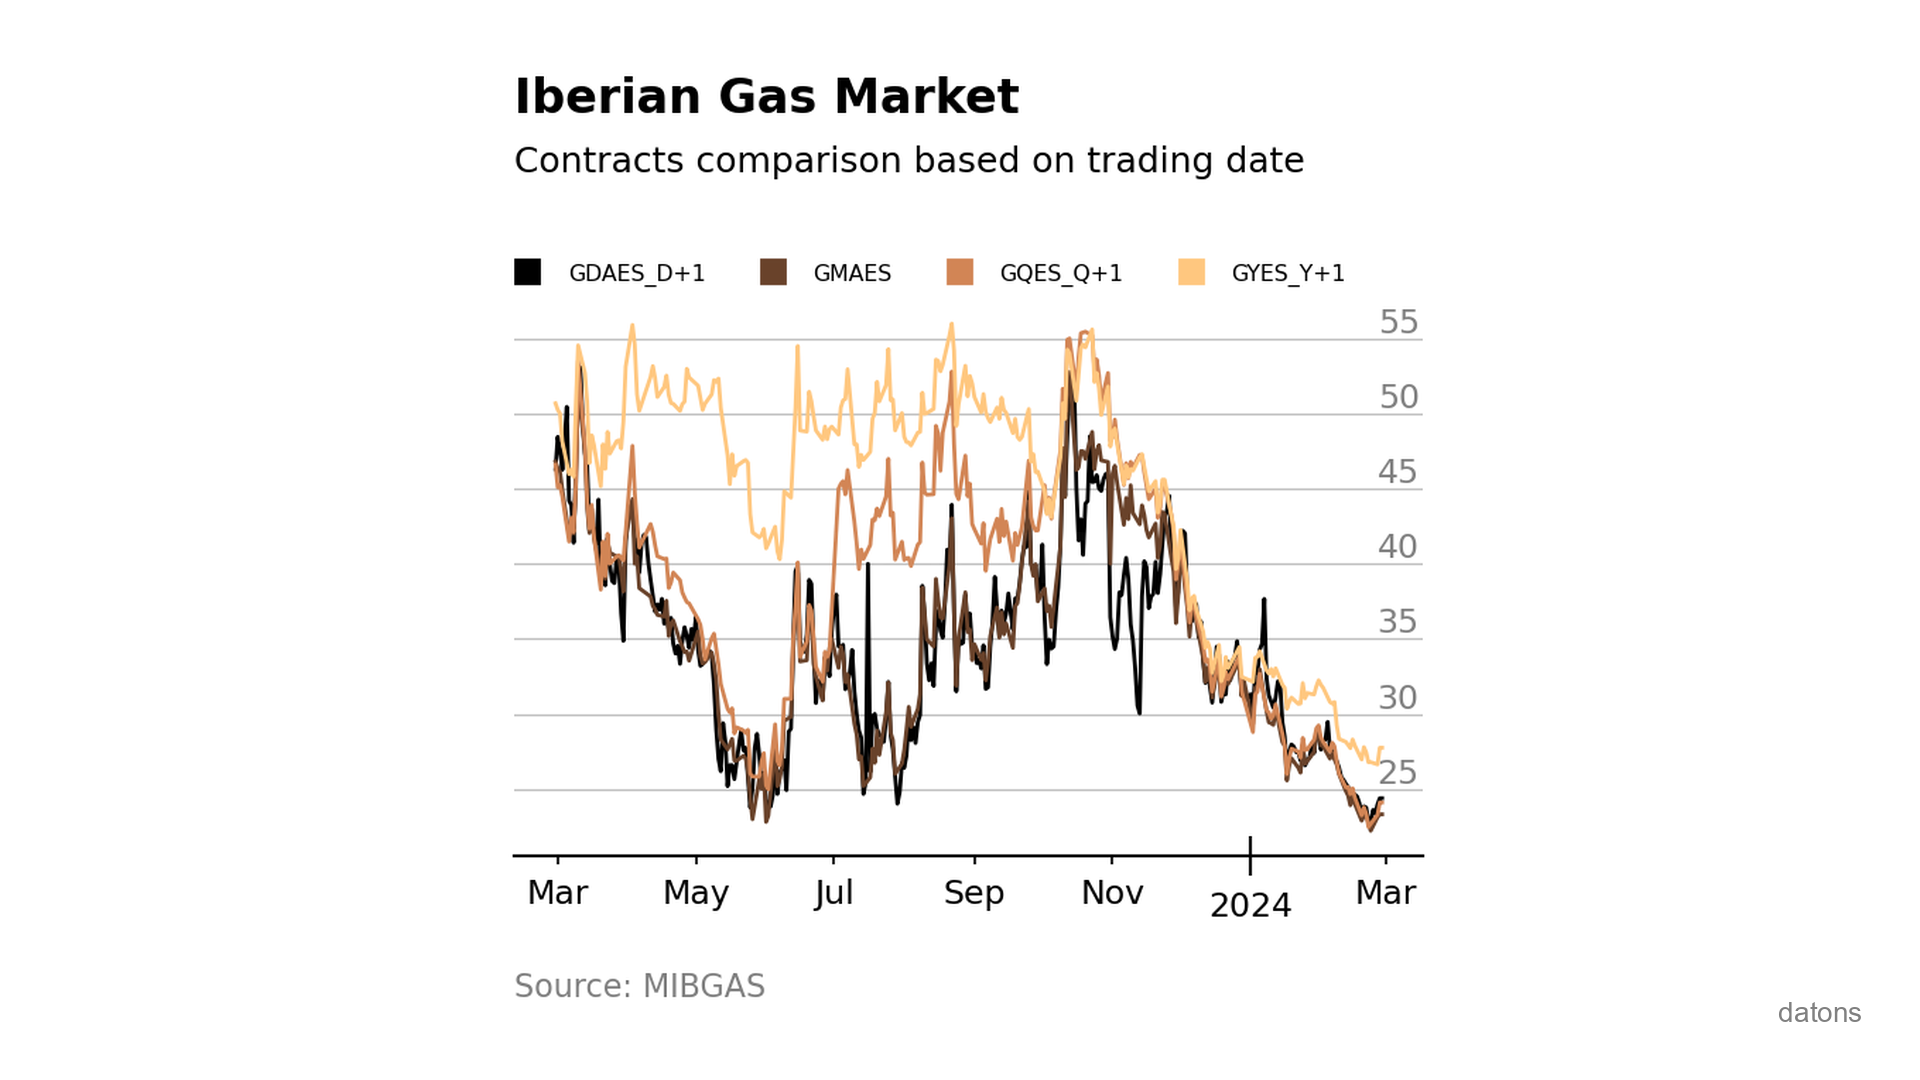
Visually comparing contracts from Iberian gas market MIBGAS
Discover how to analyze and visualize MIBGAS contract prices using Pandas and Matplotlib. This tutorial guides you through data filtering, date handling, and interpolation techniques.
Read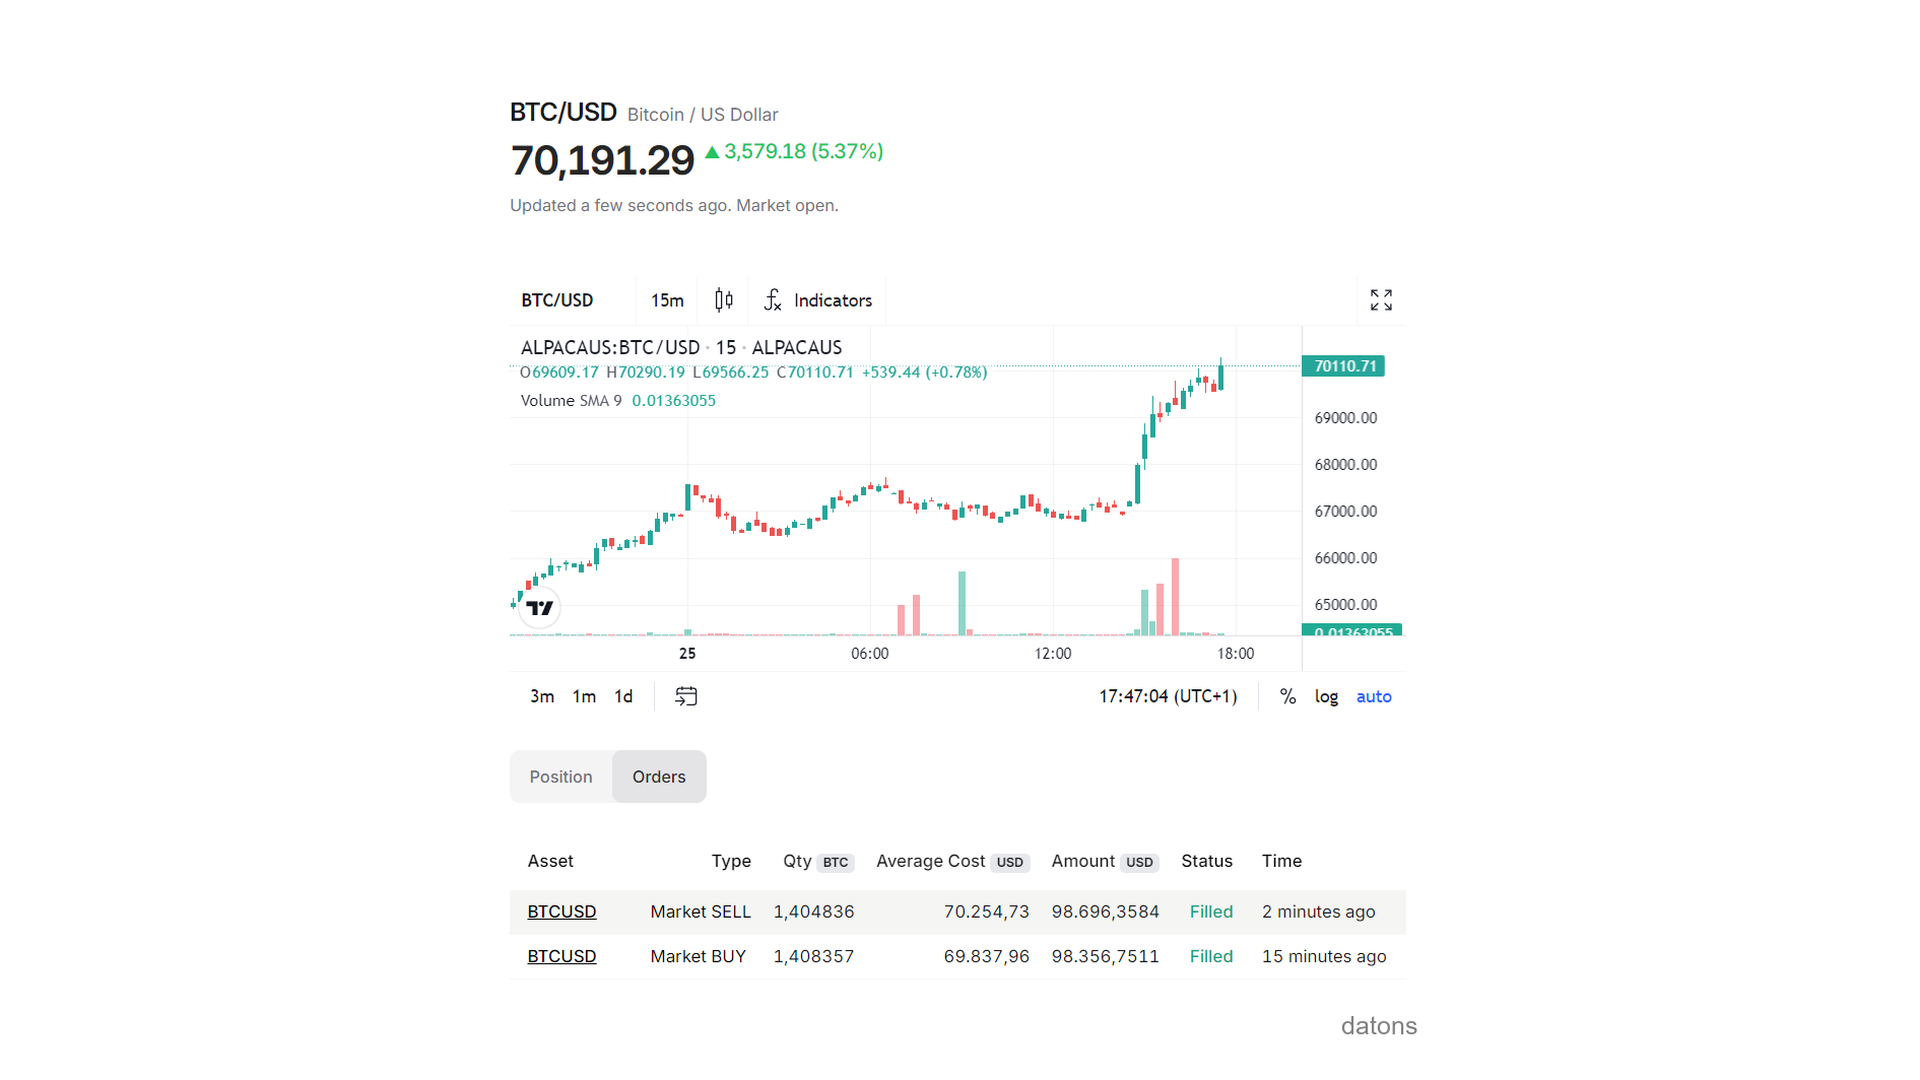
Program trading orders with Alpaca API in Python
Learn how to automate trading strategies by programming buy and sell orders with Python using the Alpaca API.
Read