Imagine you are an investor in renewable energies and want to analyze energy curtailment in Spain to evaluate the profitability of building a photovoltaic solar park.
Curtailment is the energy that, although it could be generated, is not due to technical restrictions imposed by the system operator (REE in Spain) to maintain system stability.
For example, the programming unit FVGNRA experienced a curtailment of 16,922.4 MWh during the year 2023. At a low estimate, if the captured price for photovoltaic energy were 20€/MWh, the curtailment meant a loss of 338,448 €.
As an investor, you must consider curtailment to obtain greater accuracy in profitability calculations.
I90 files context
Locate data
First, we must find the historical curtailment data by energy programming unit, which is found within the I90 files provided by the system operator (REE).
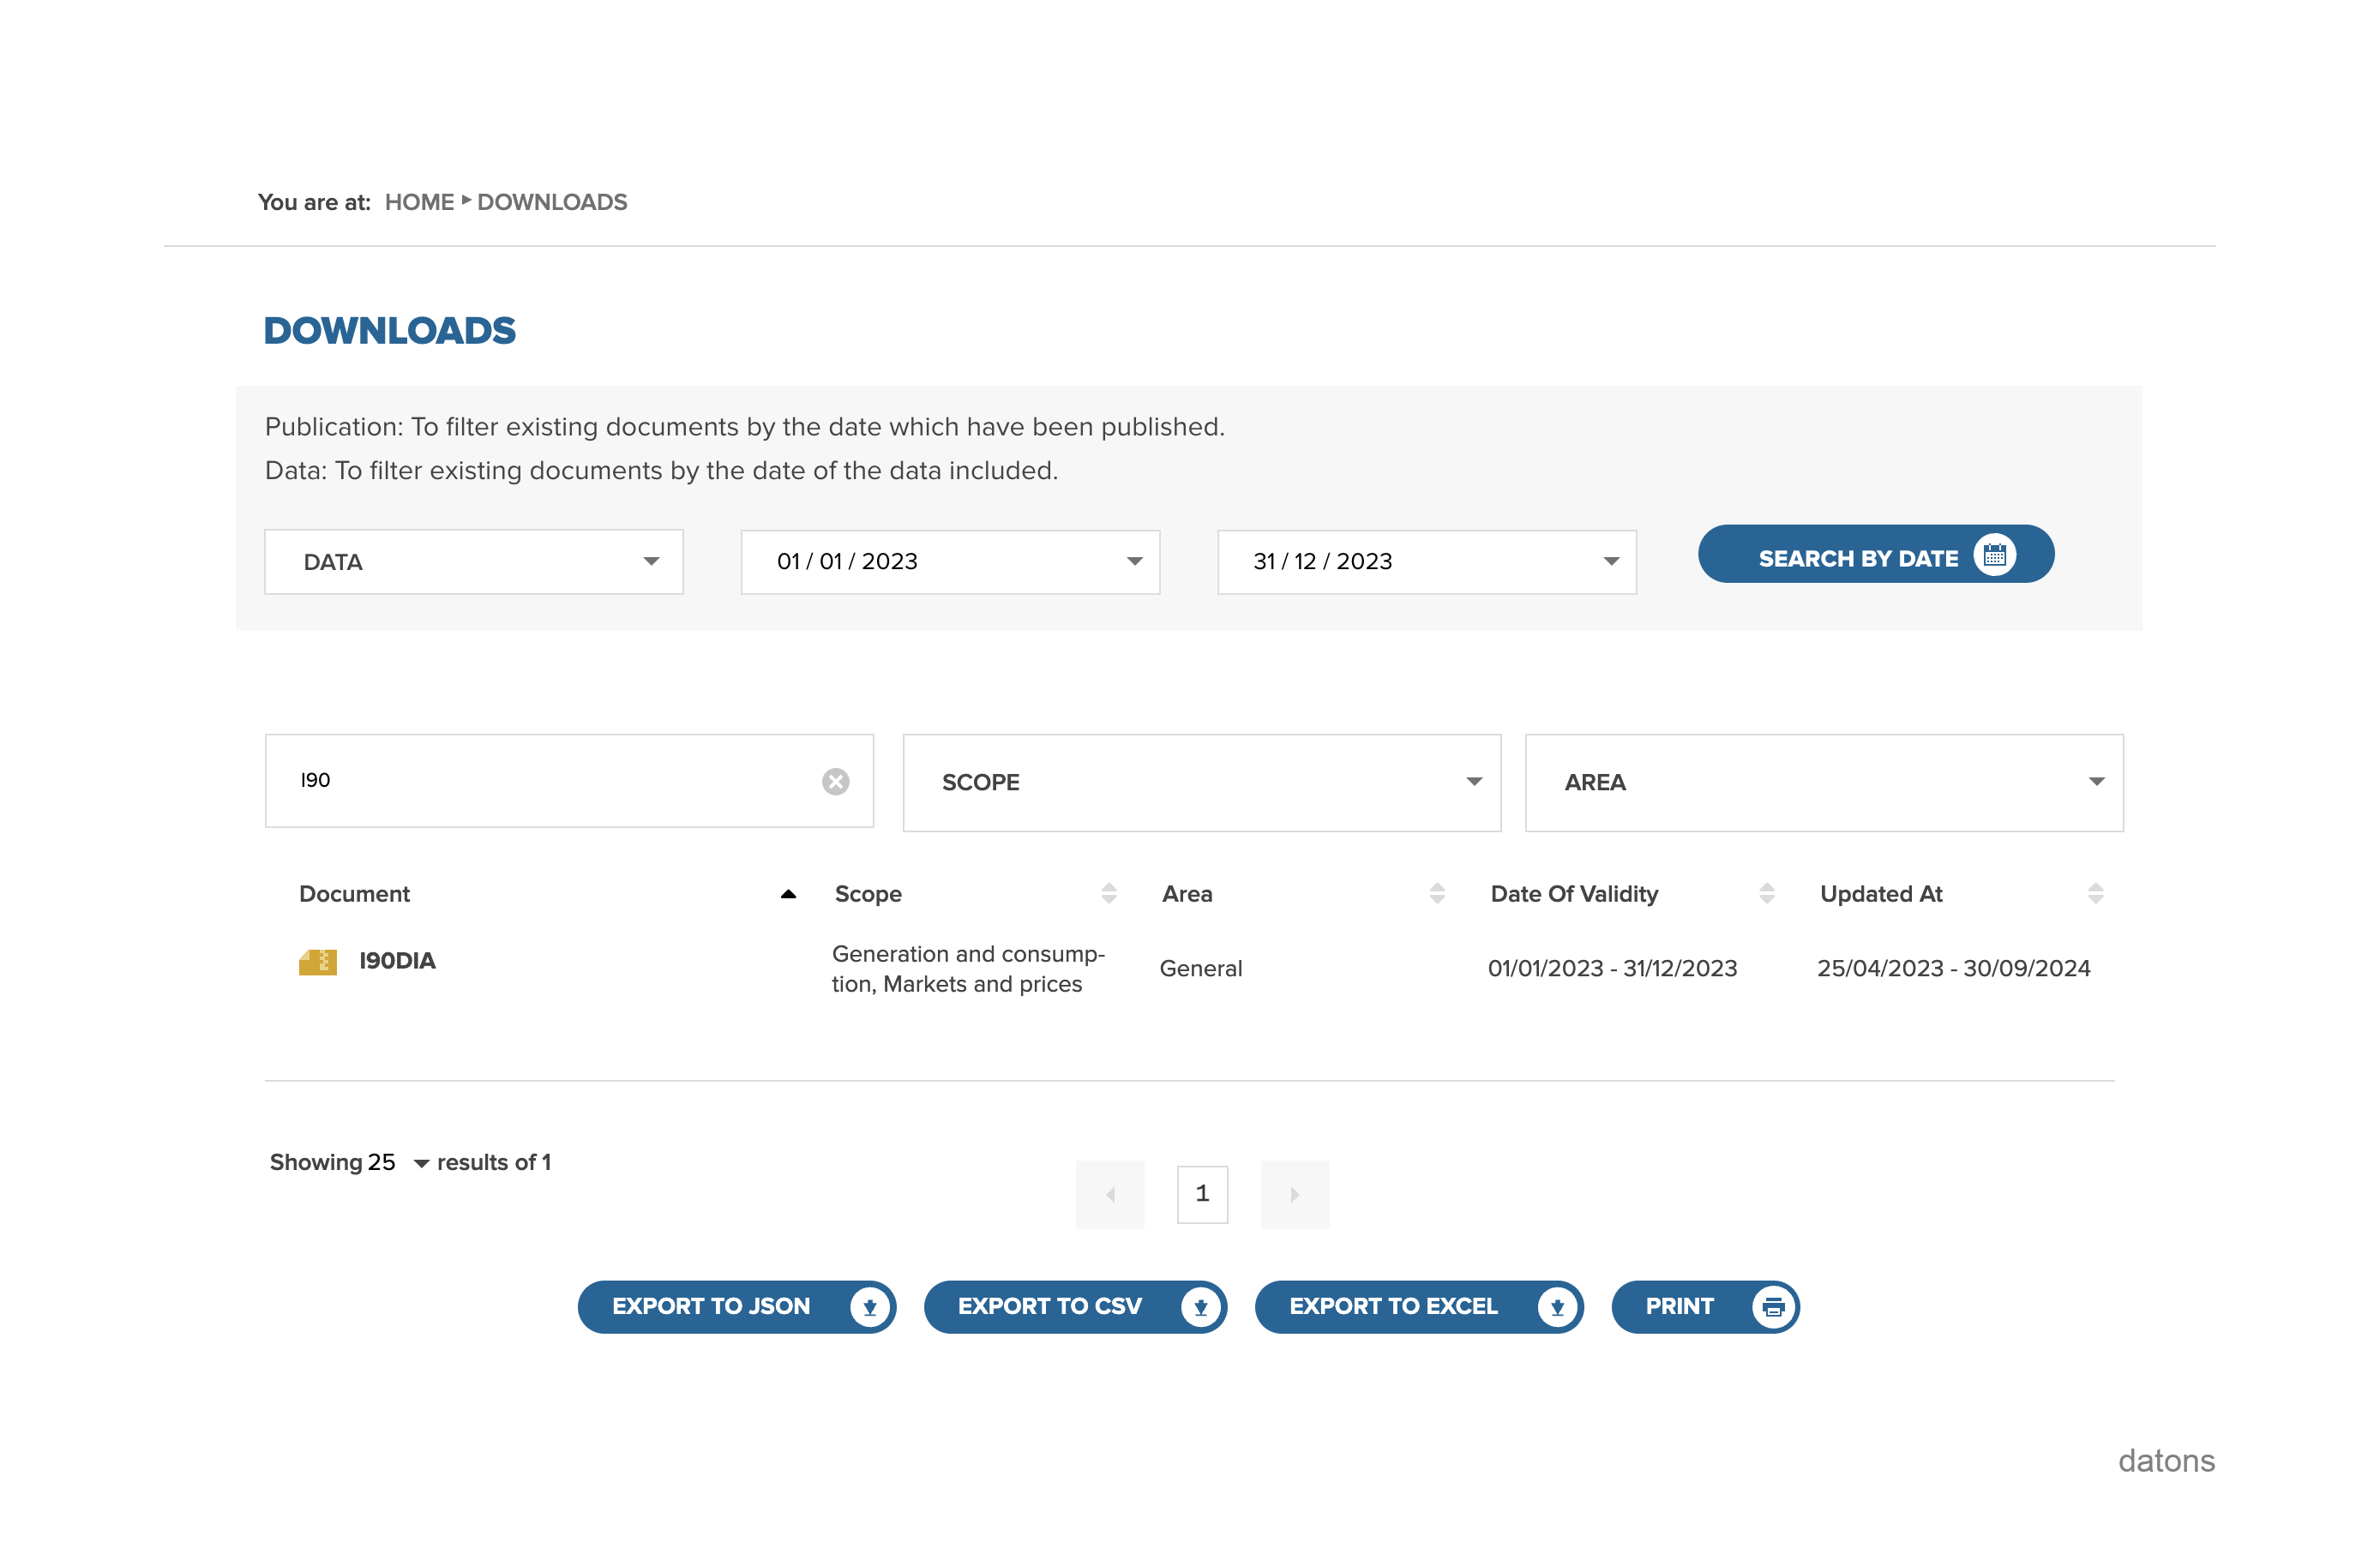
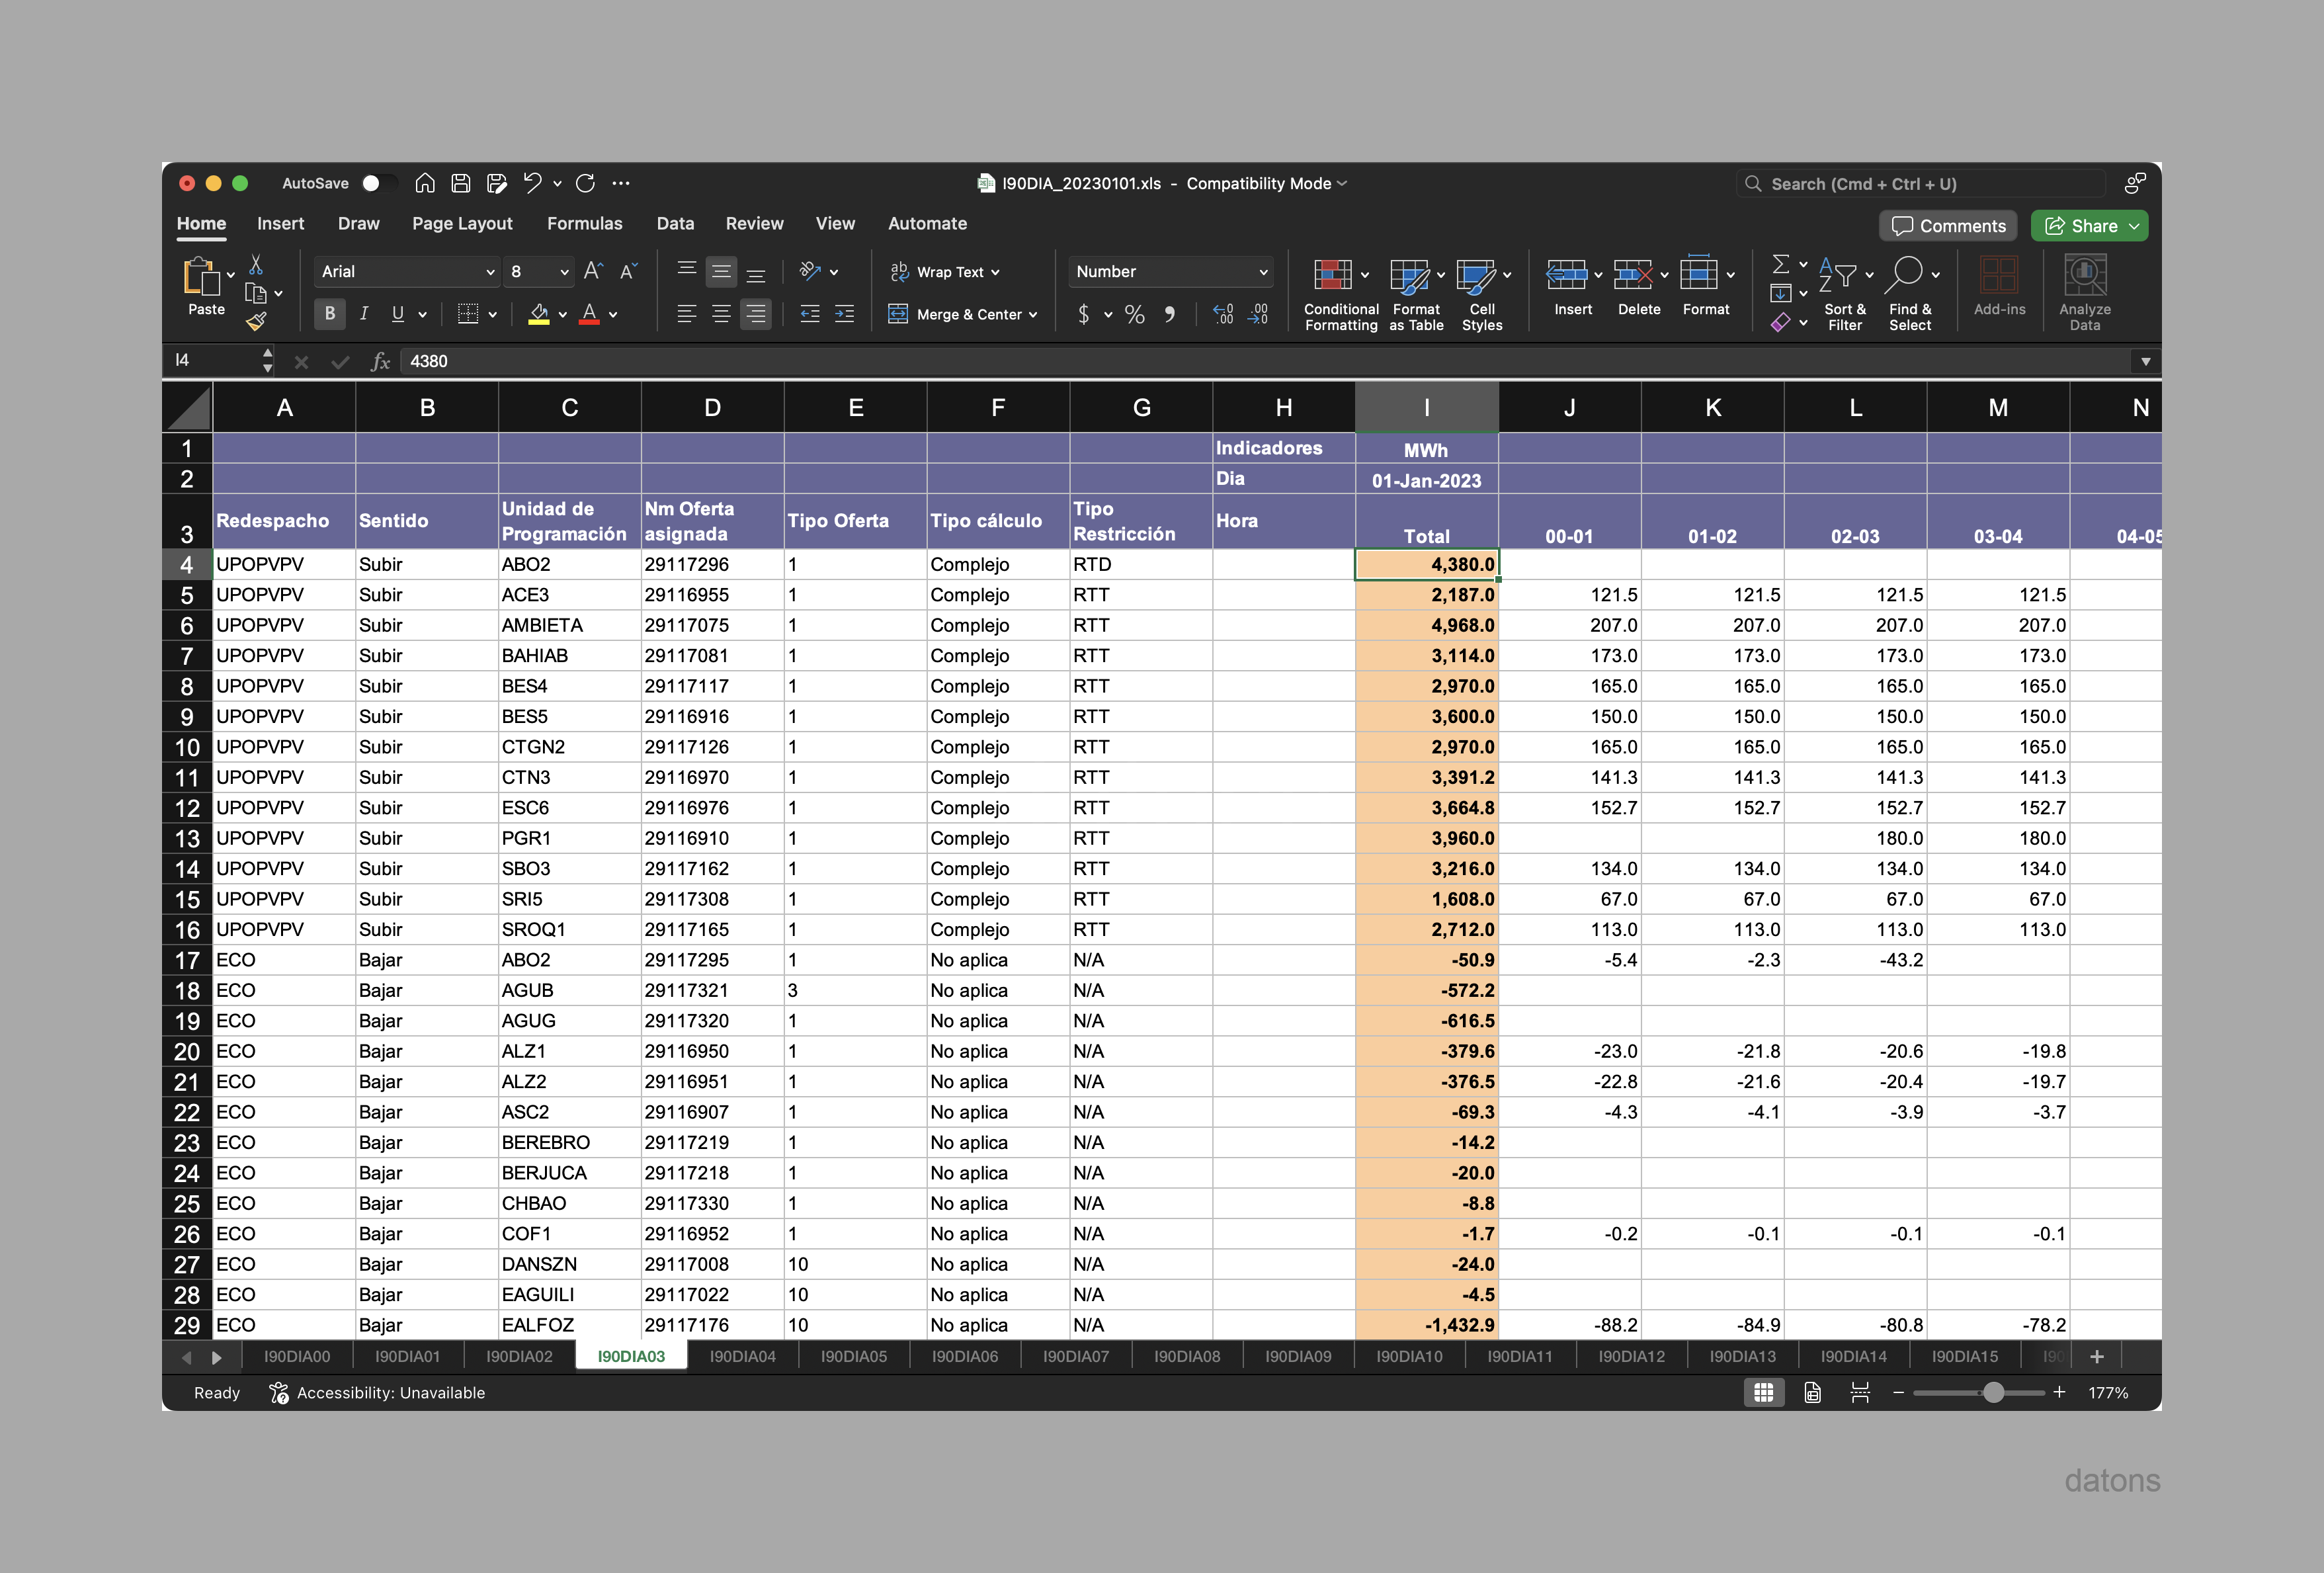
The I90 files break down the information of each energy programming unit according to the generation programs for each day in an Excel file.
Understand structure
Before diving into programming, we must understand the structure of the I90 files, which distribute the information across separate sheets according to the type of generation program and type of measure (generation, prices, and offers).
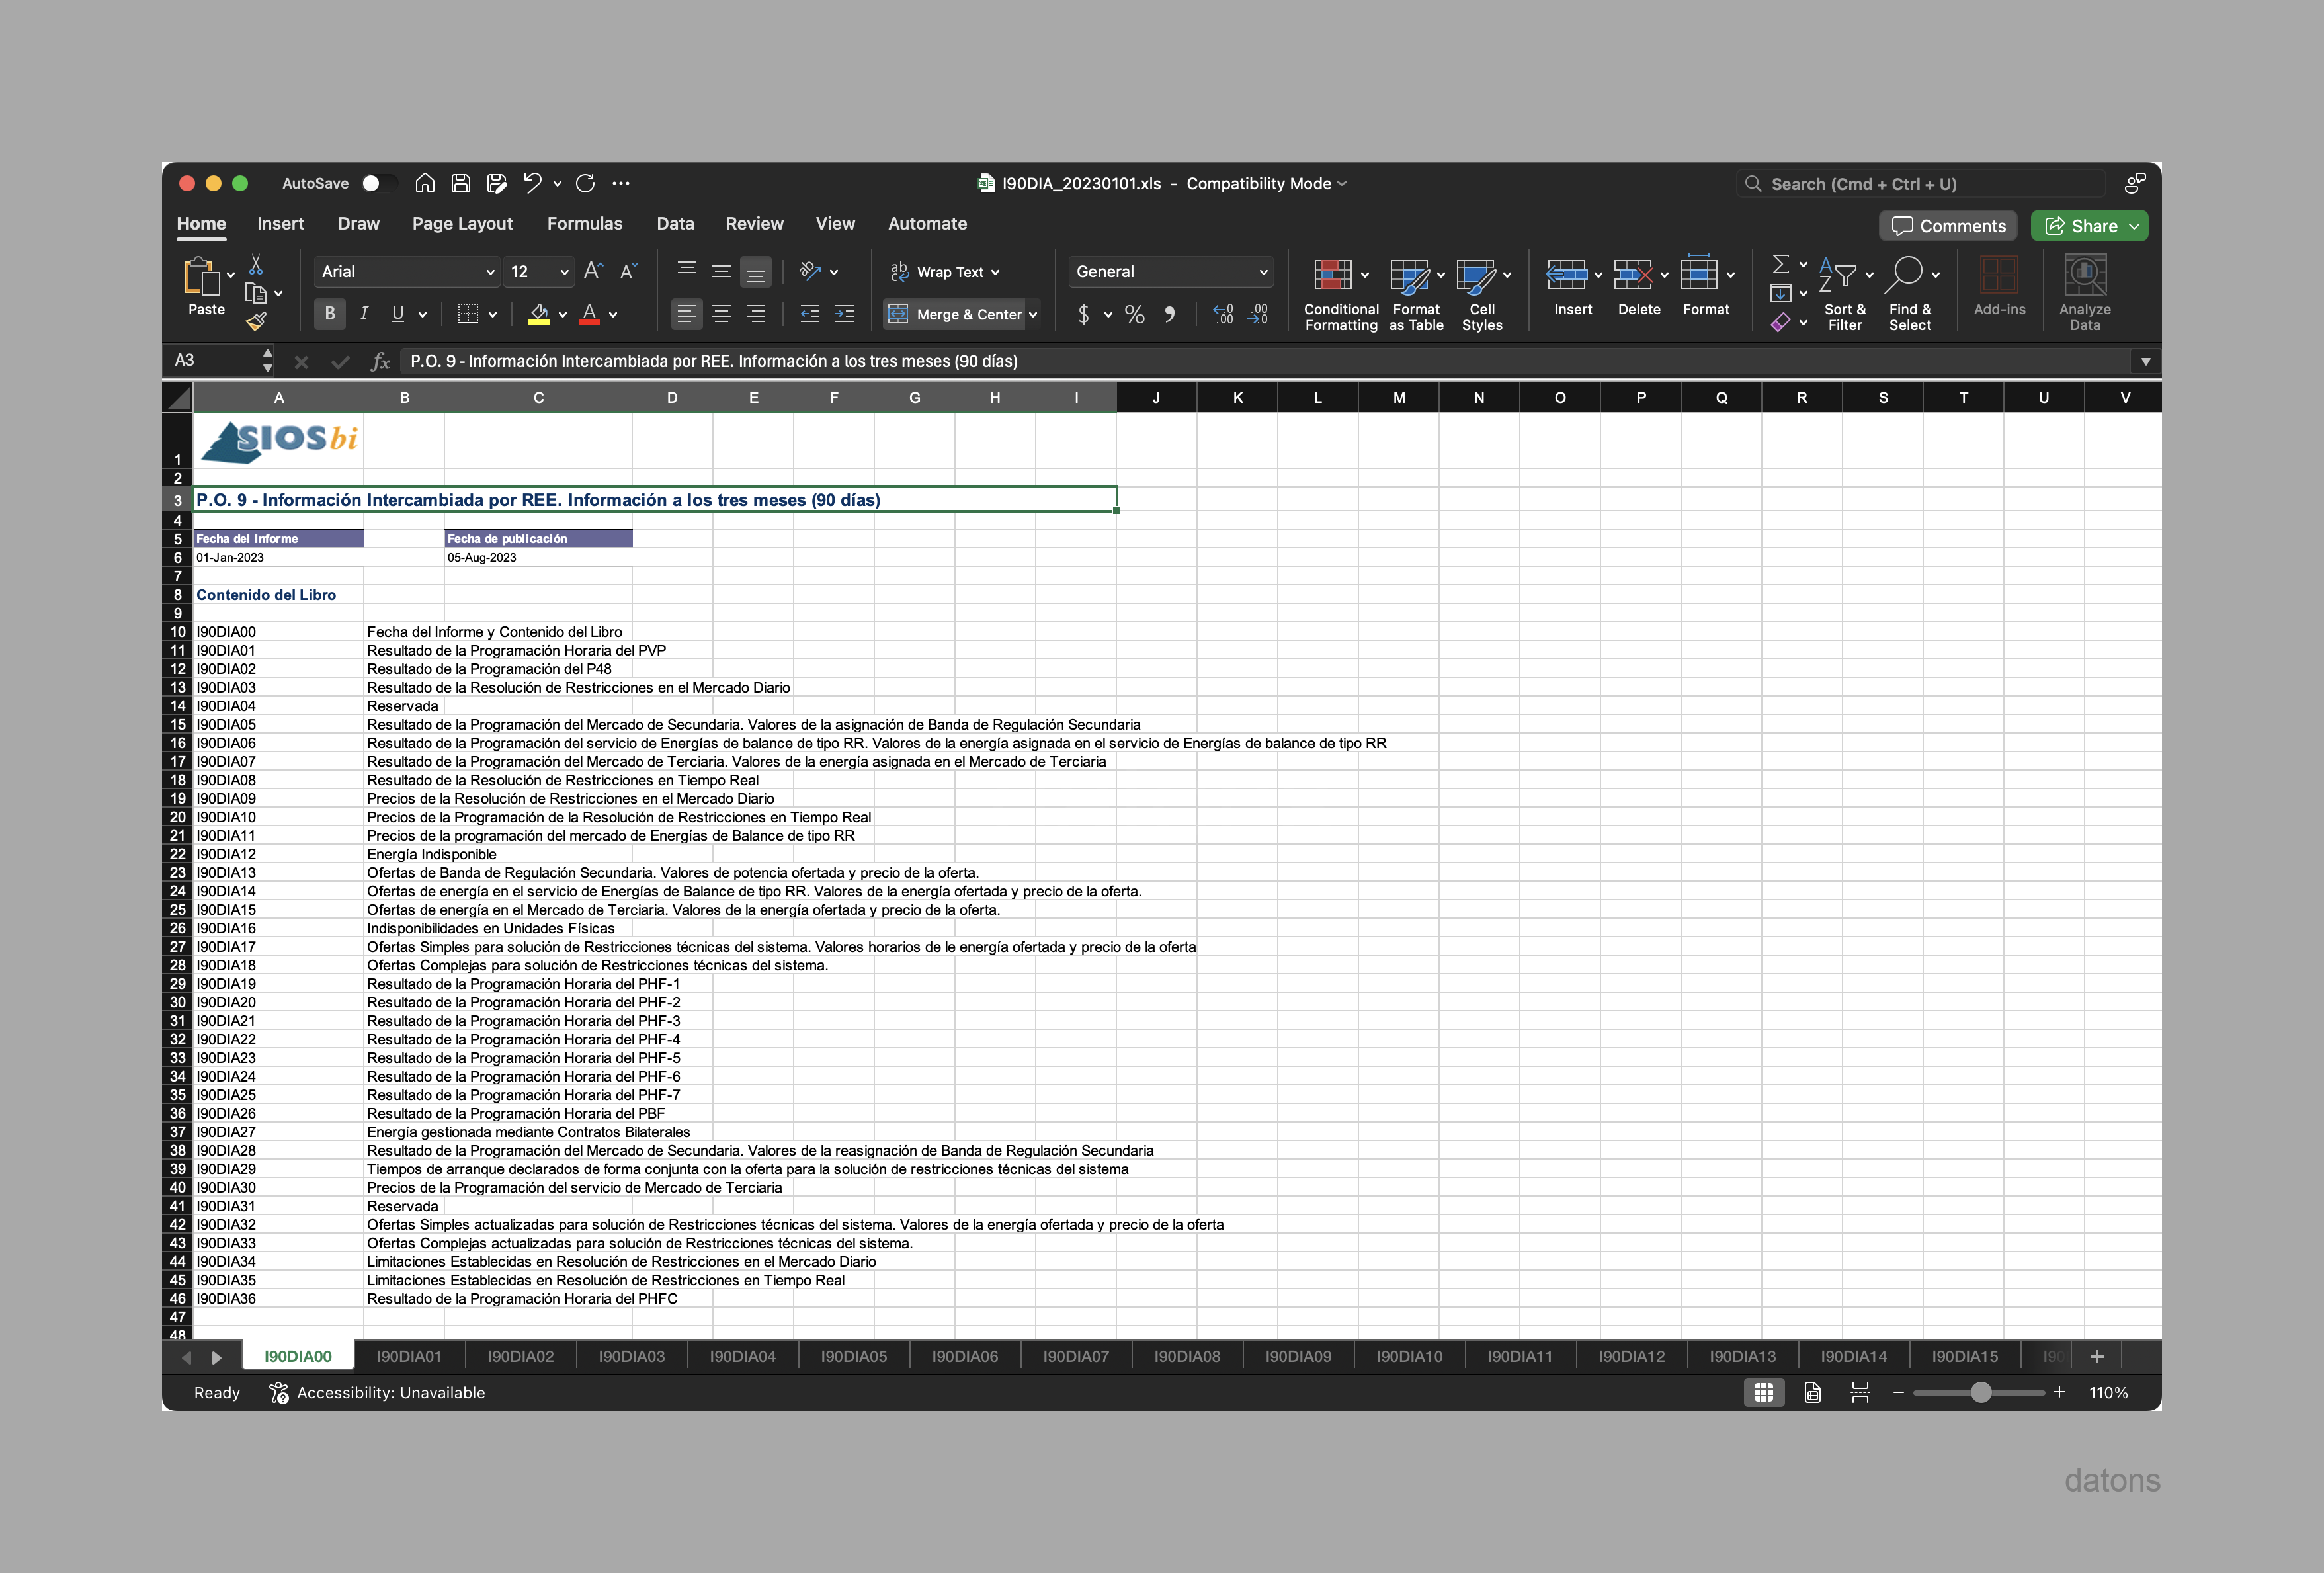
The curtailment information is found in the sheet I90DIA03: Resultado de la Resolución de Restricciones en el Mercado Diario, filtering by Sentido: Bajar and excluding -Redespacho:ECO.
Automation process
Design process
Once the exact data sequence we need is located, we must design the automation process.
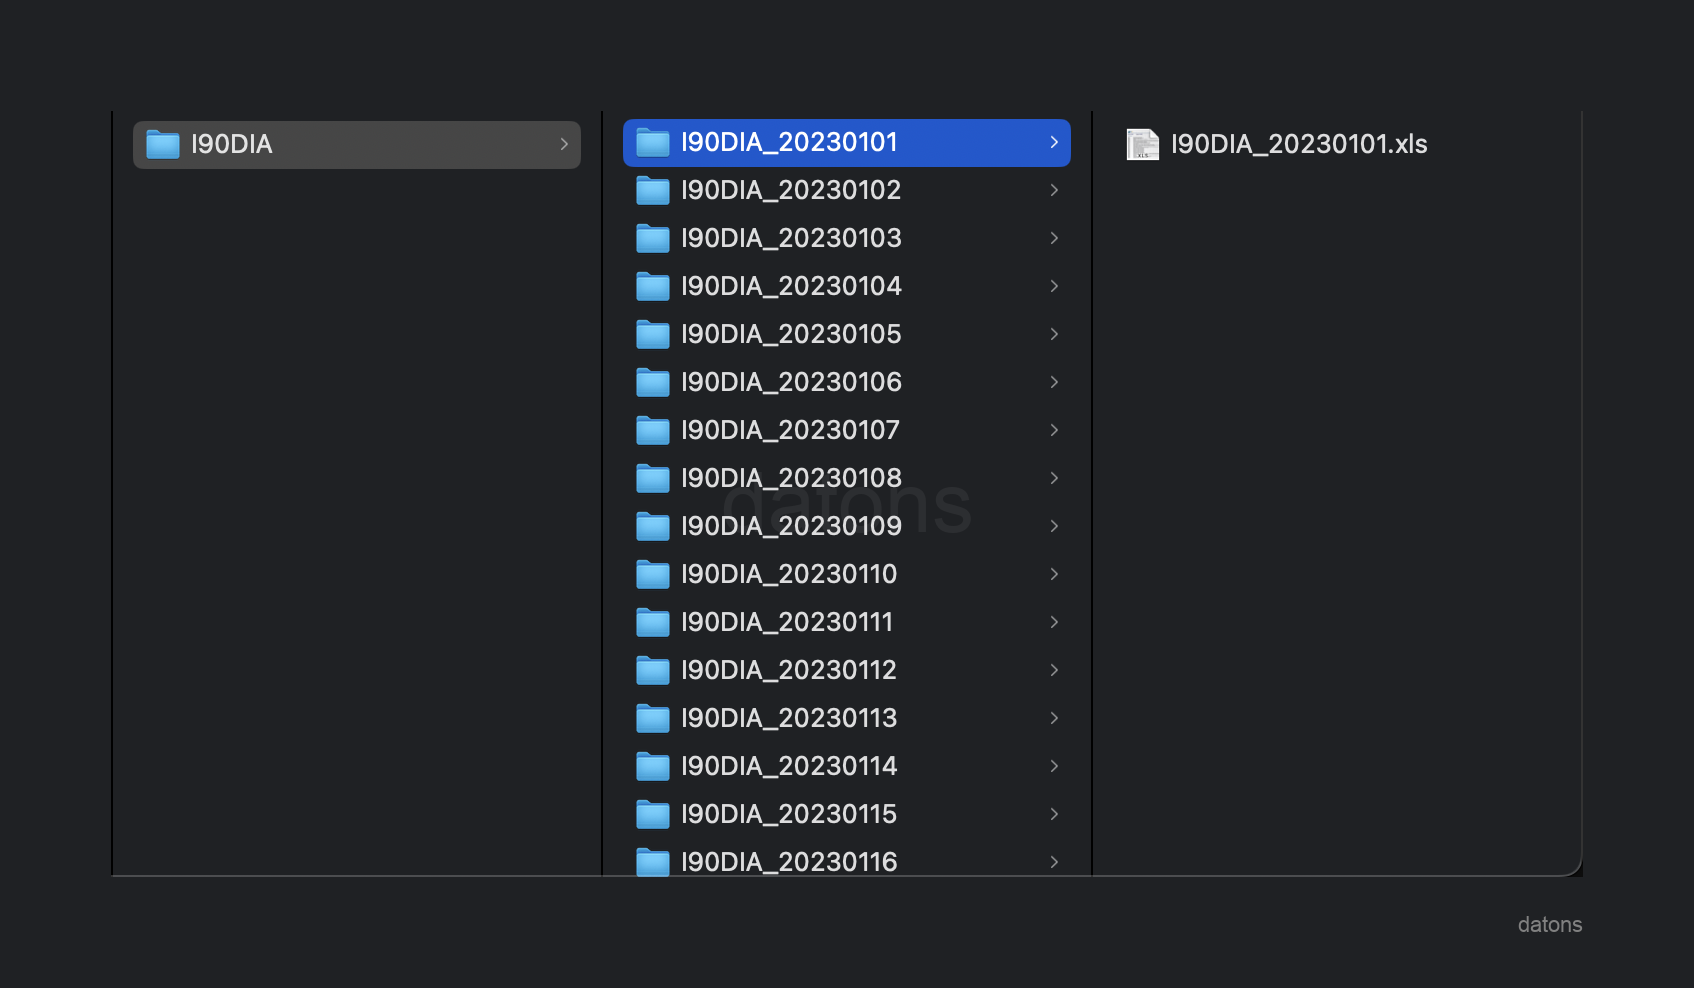
The first thing to consider is that the Excel file only contains information for one day, so the process must be replicable for any I90 file.
Once all I90 files are processed, they will be combined into a single data table, allowing us to manipulate and analyze historical information. Therefore:
- Create a function to preprocess any sheet of the I90 file.
- Combine all I90 files into a base table.
- Export the base table to Excel to develop multiple analyses.
- Develop multiple analyses from the base table.
Create function for a file
Since all I90 files follow a similar structure, we select one of them to develop the process.
The table provided by Excel is in wide format, segmented by hours in each column and referring to the same variable (energy generated in a specific hour).
To manipulate and analyze the information, we must convert the table to a long format, where each column represents a variable. That is, group the hours into a single datetime column and the generated energy into another value column.
path = "I90DIA/I90DIA_20230101/I90DIA_20230101.xls"
preprocess_i90_file(path, sheet_name="I90DIA03")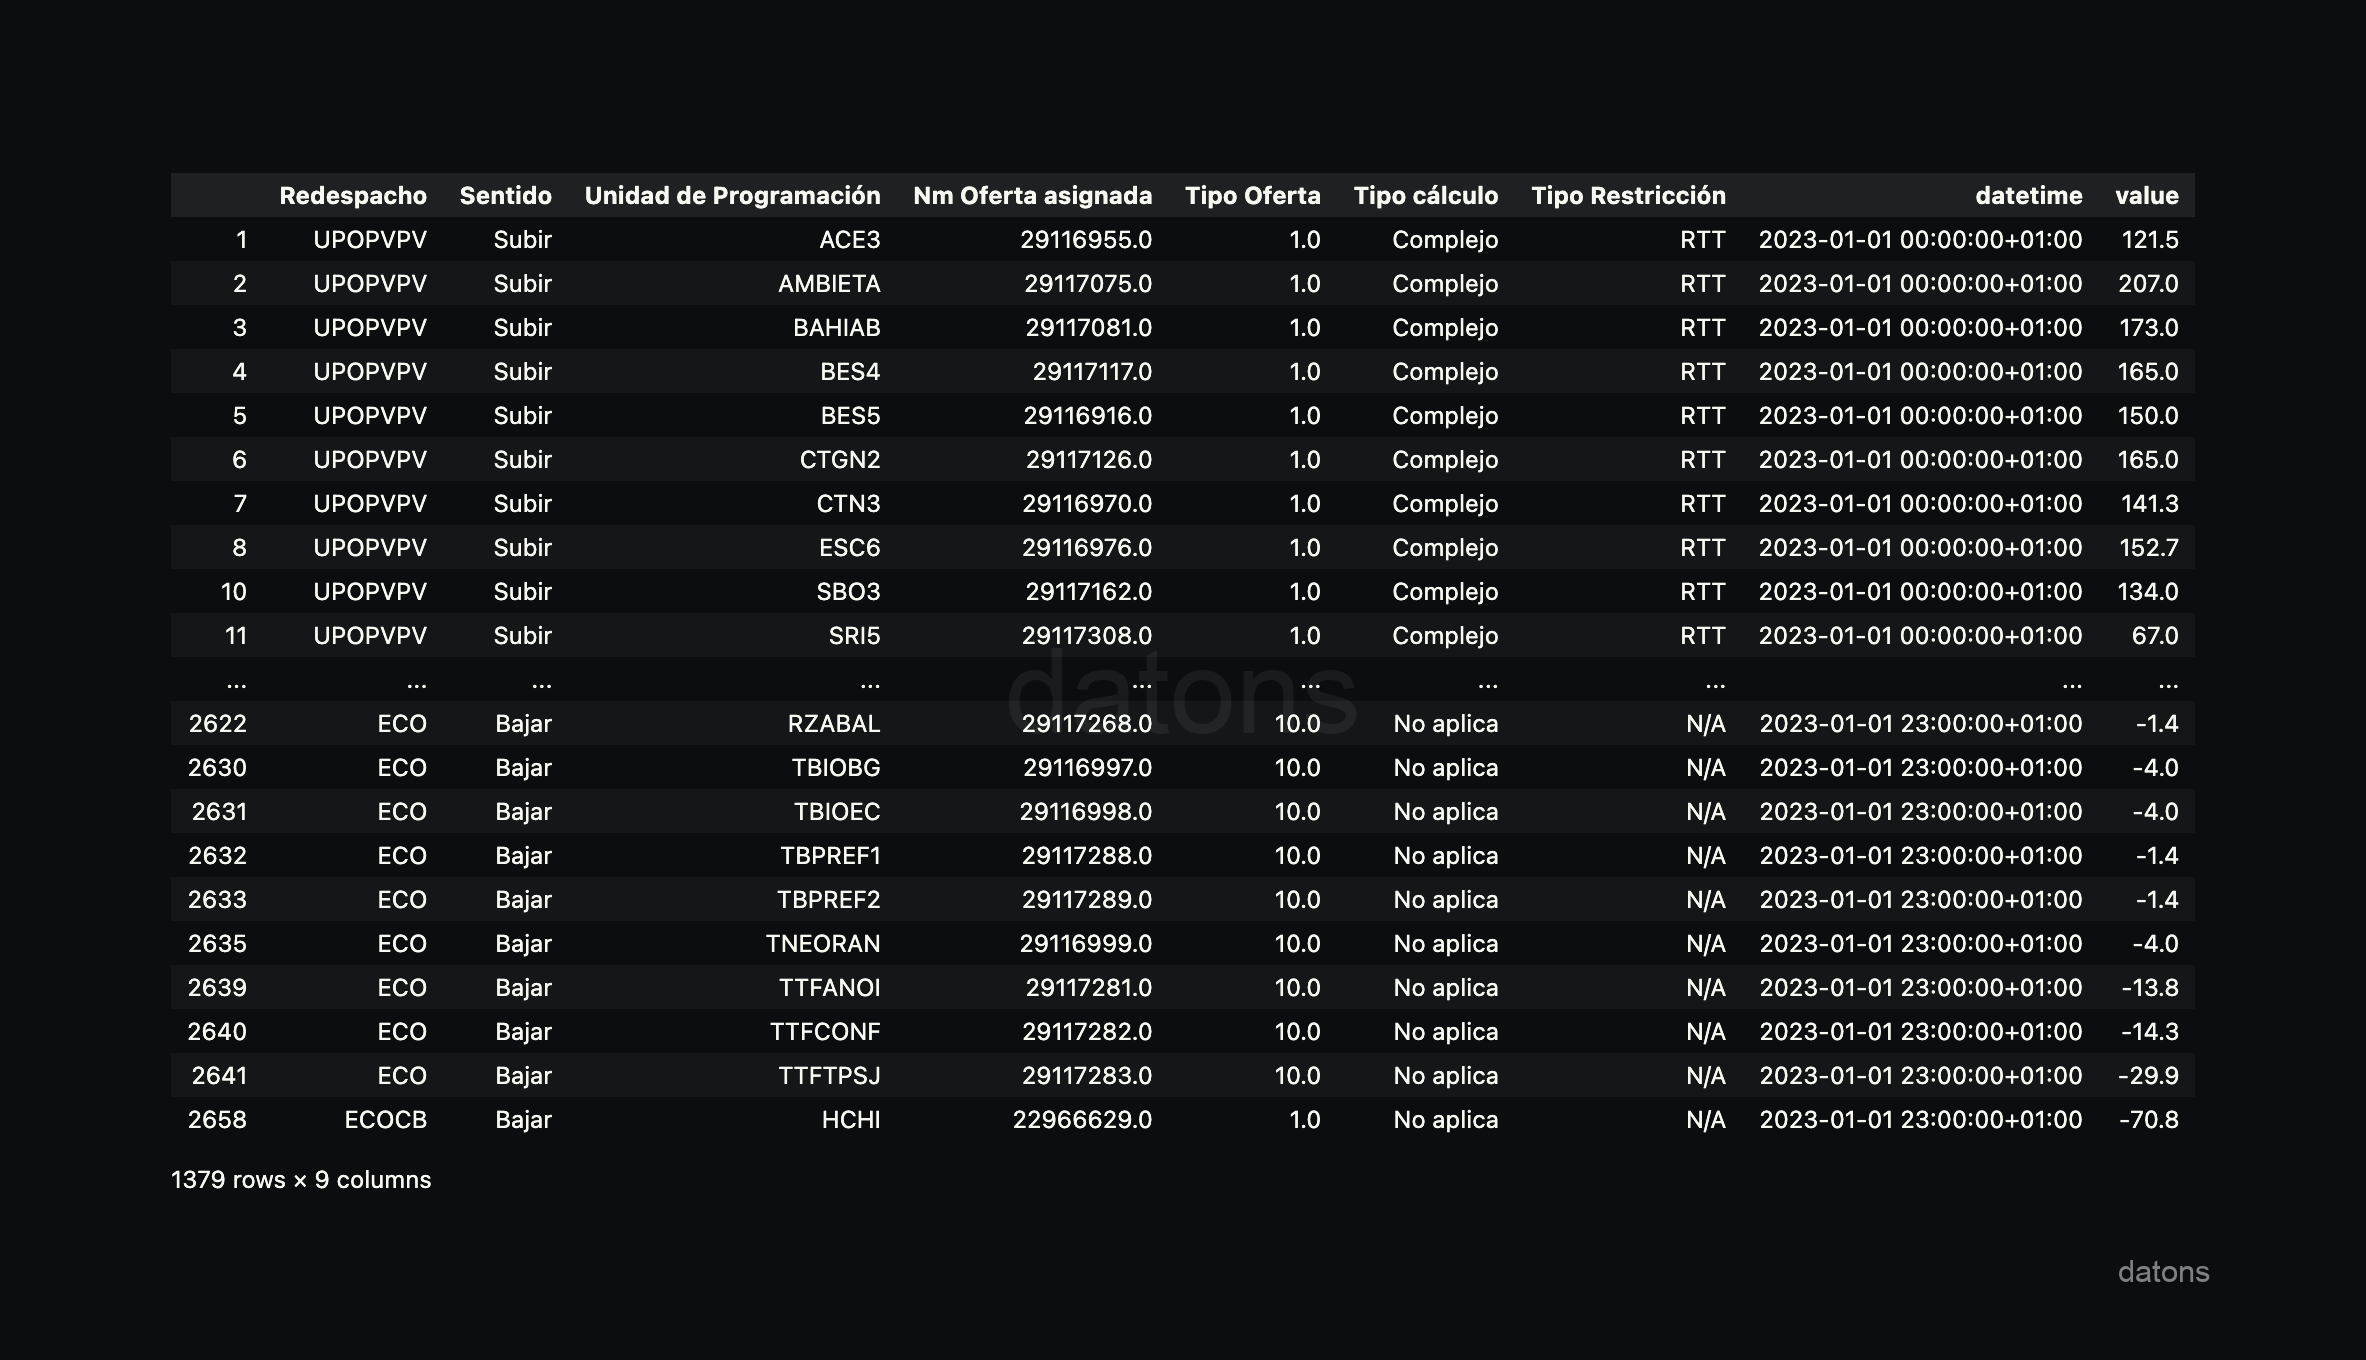
Combine all files
The good thing about Python is that we can apply the same function to all I90 files to finally combine all the files into a single table.
First, we obtain the list of I90 files for the year 2023, which are located in the I90DIA folder.
import glob
path = "I90DIA/I90DIA_2023*/I90DIA_2023*.xls"
files = glob.glob(path)
Now, we apply the preprocess_i90_file function to each file through a for loop, where we also store each table in a list to finally combine all the tables into one.
dfs = []
for file in files:
   dfs.append(preprocess_i90_file(file, sheet_name="I90DIA03"))

df = pd.concat(dfs)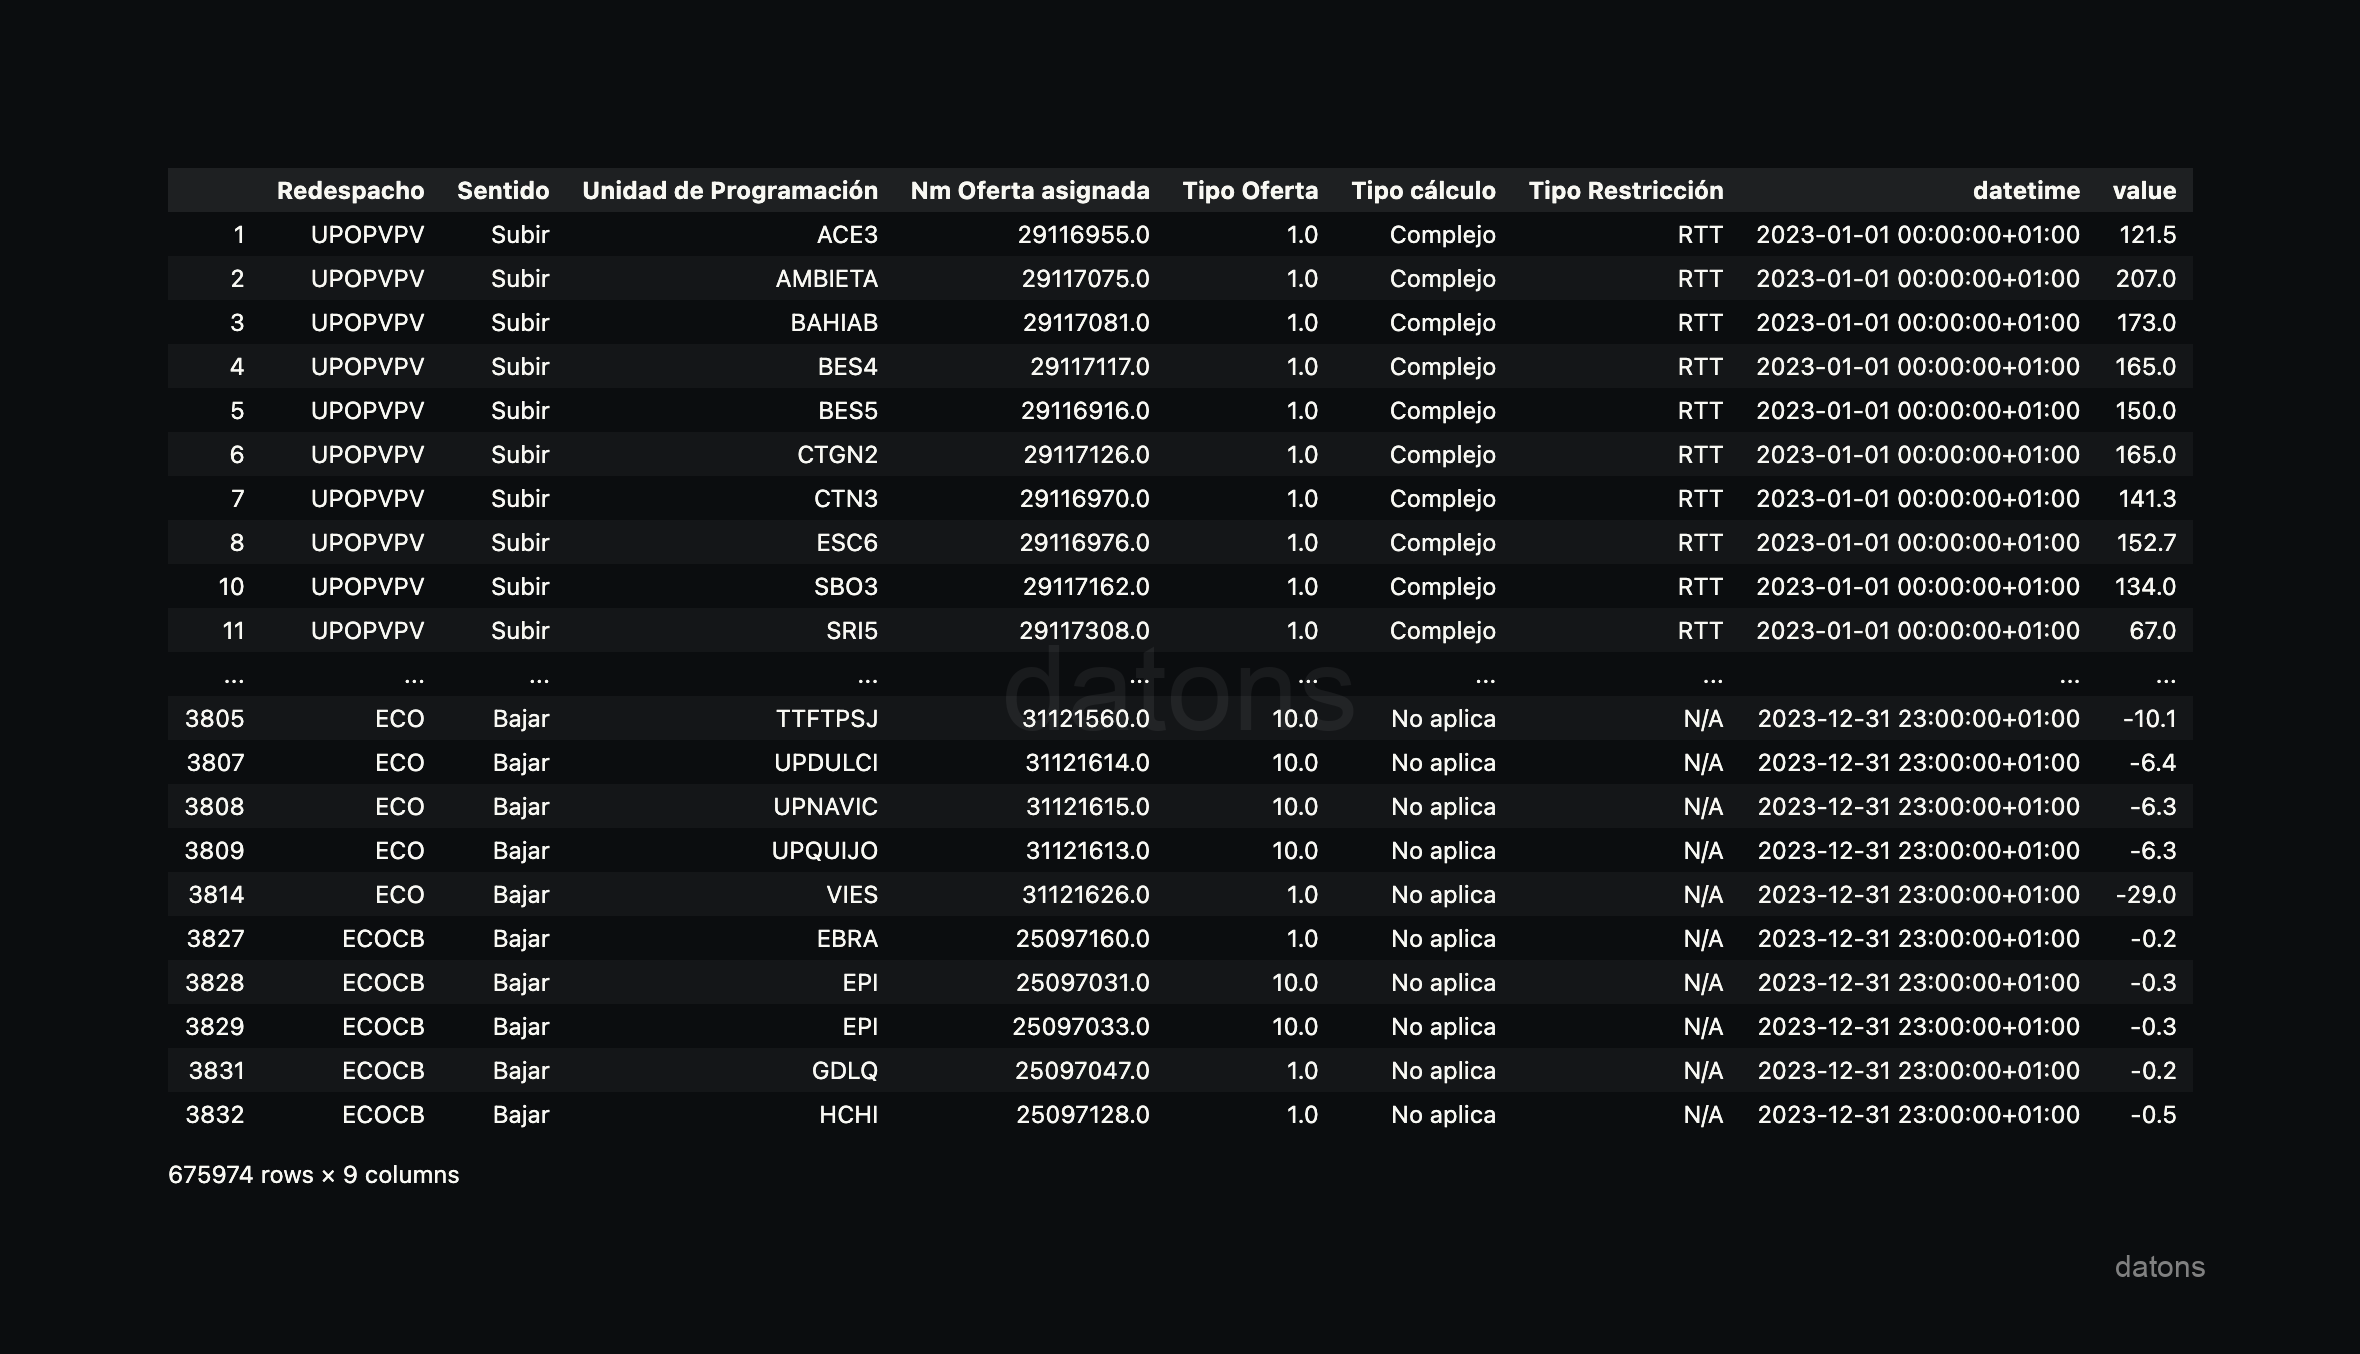
If we had filtered by Sentido: Bajar from the beginning, we would be losing information that may be relevant for other analyses and would add repetitions.
Therefore, we could not only analyze curtailment but also other relevant aspects such as Sentido: Subir, Redespacho, or Tipo Restricción, among others.
Export data to file
To avoid having to preprocess the data again when developing an analysis, it is advisable to export the table from Python to an Excel file.
df.to_excel("I90_2023.xlsx", index=False)Curtailment analysis by unit
Load data
In the same way that we exported the data, we can load it into Python to develop an analysis.
df_i90 = pd.read_excel("I90_2023.xlsx")Filter rows
In our case, we want to analyze the curtailment of the FVGNRA unit, so we filter by sign: Bajar and unit: FVGNRA.
sign = "Bajar"
unit = "FVGNRA"

df_curtailment_unit = df_i90.query('sign == @sign & unit == @unit')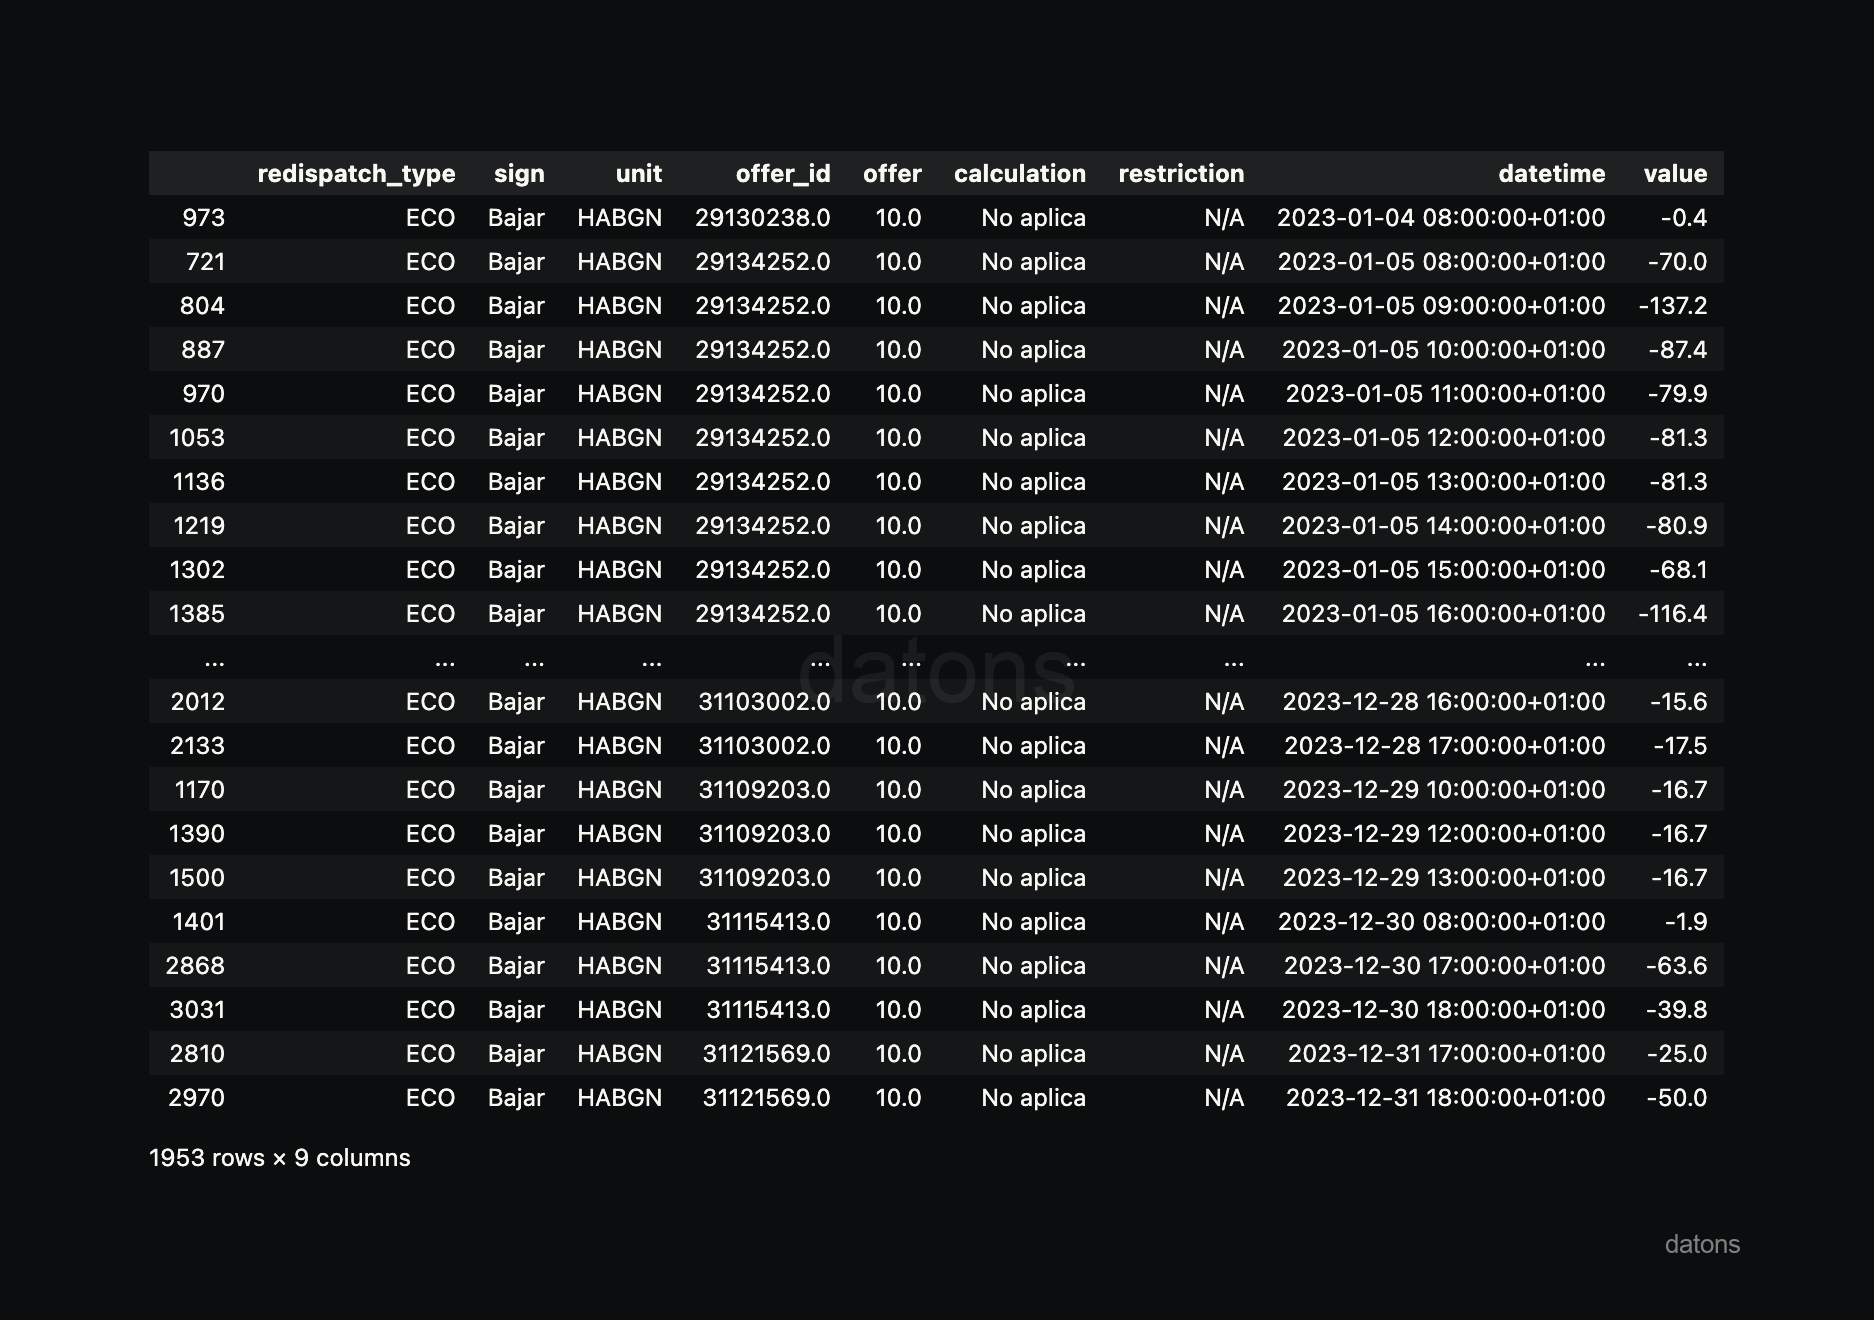
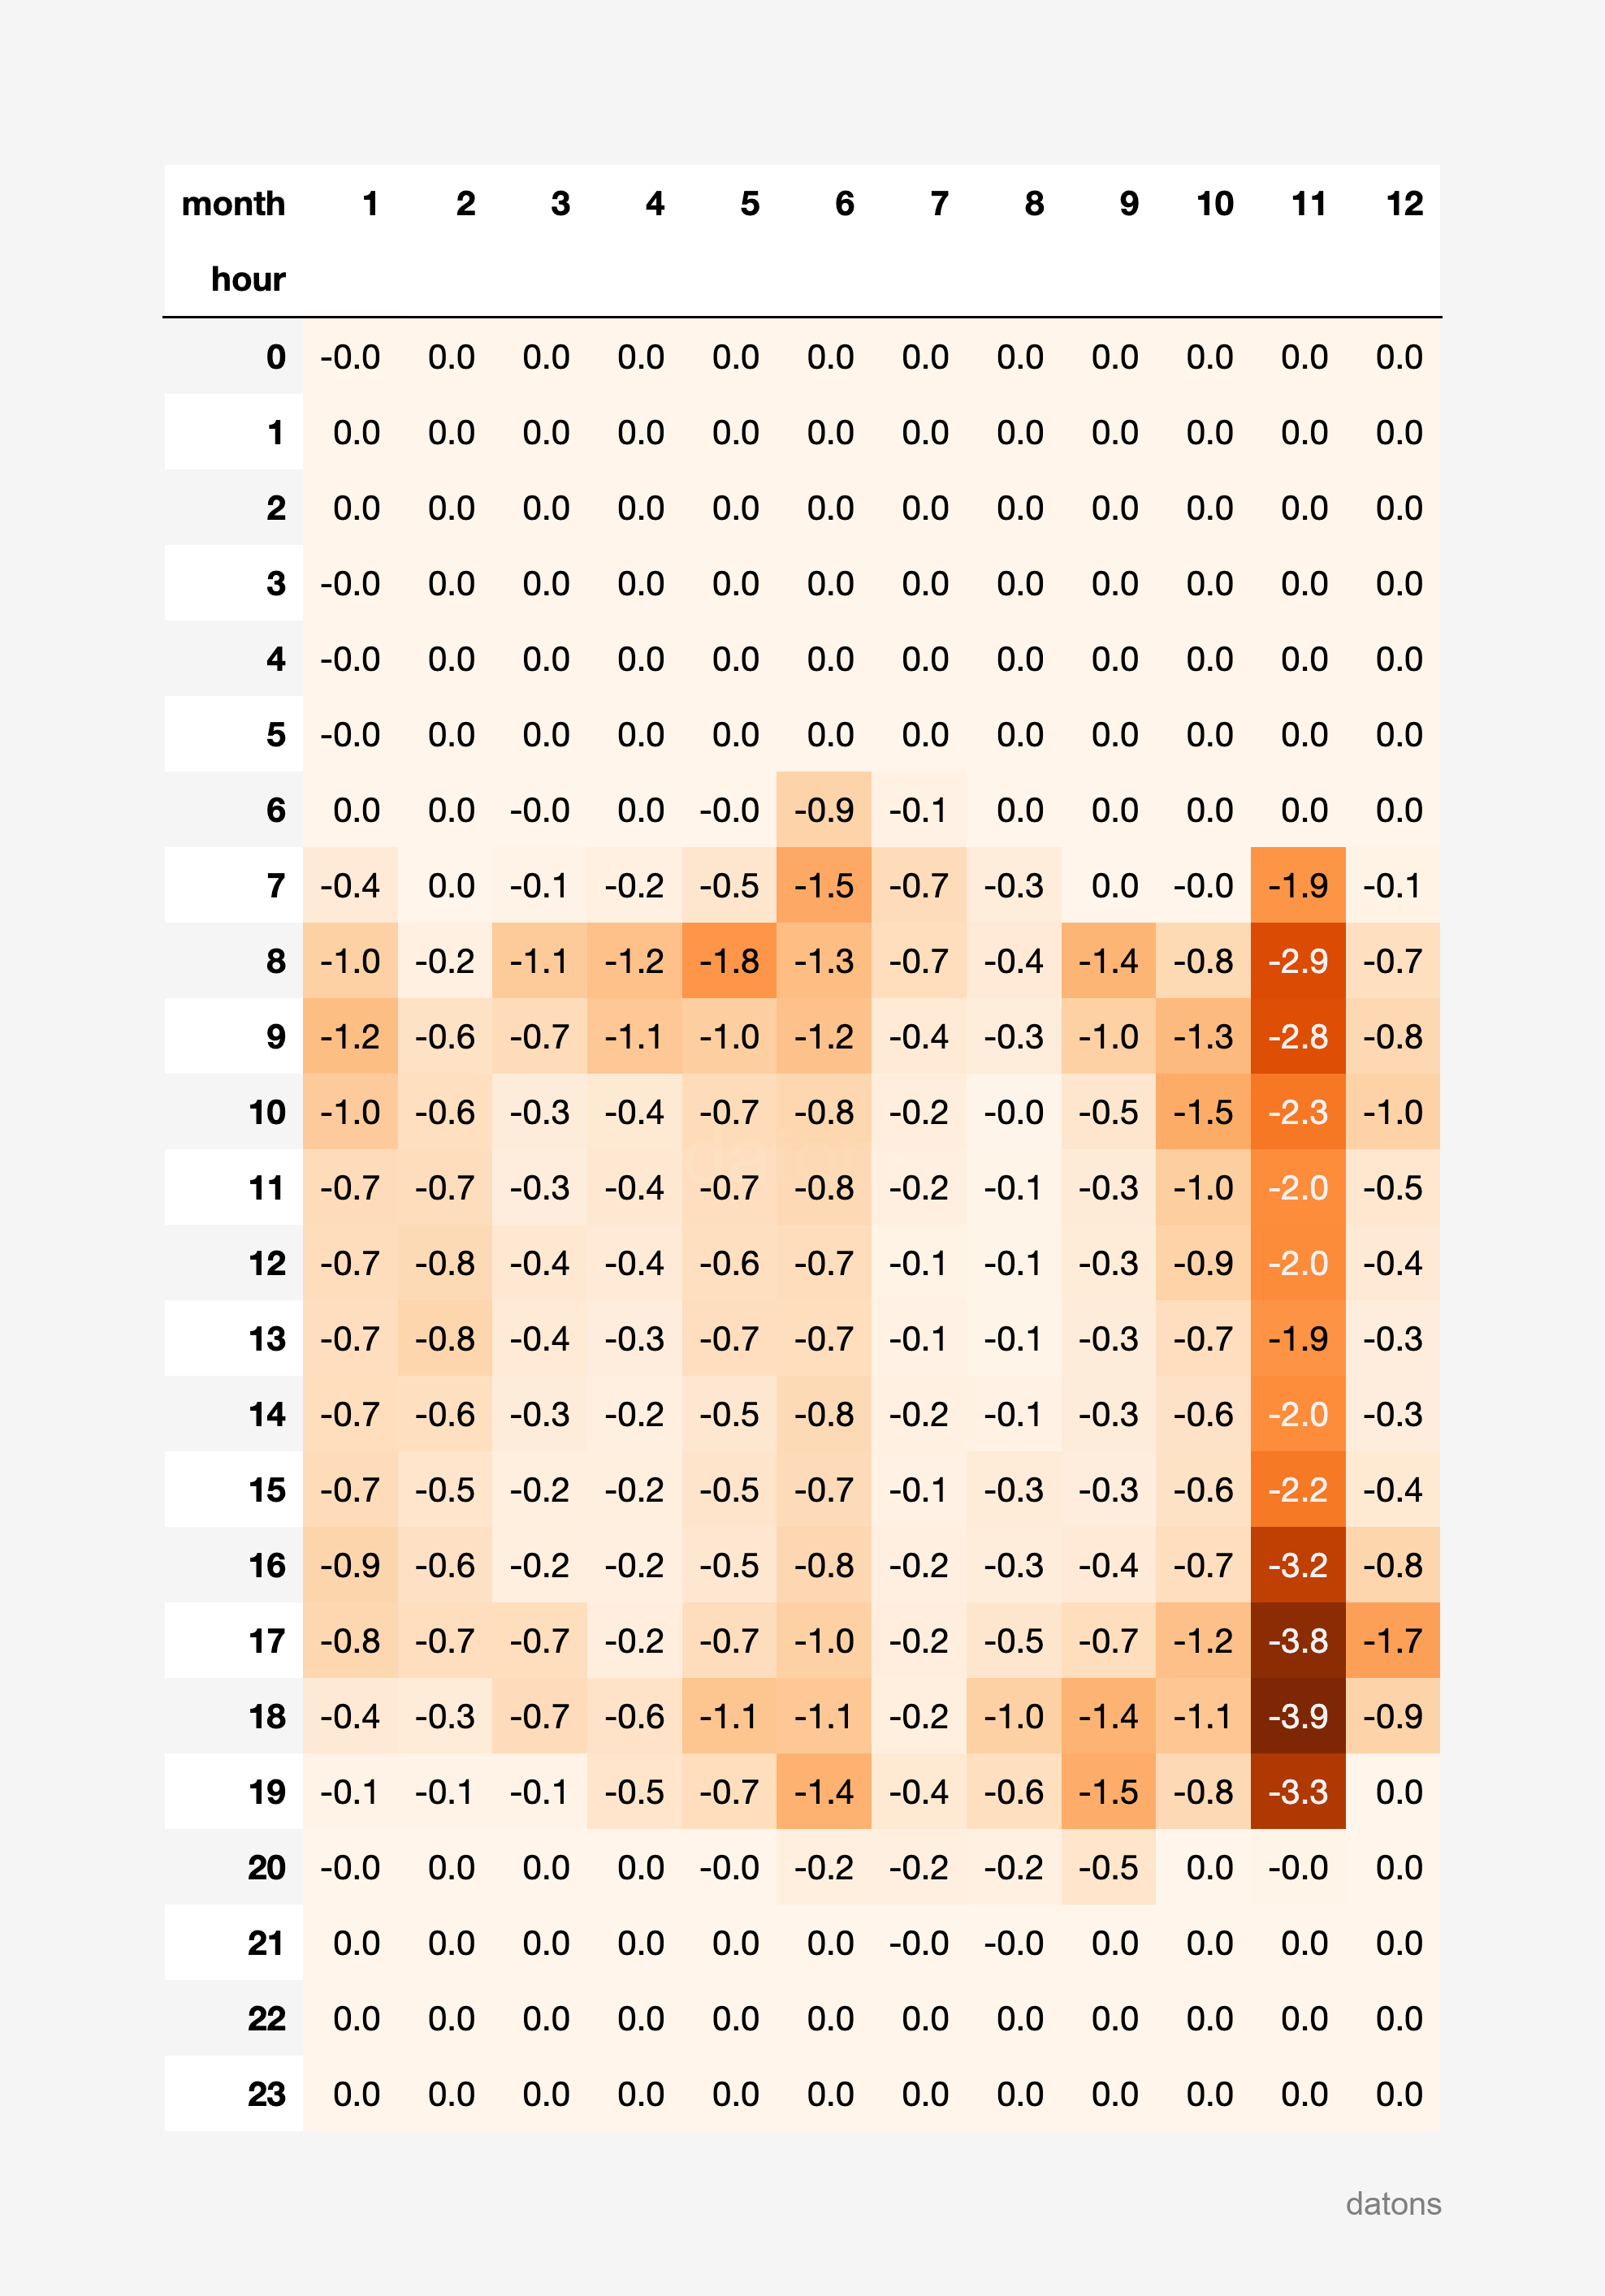
Heat matrix
To generate the curtailment report by unit, we develop a function that generates a heat matrix, highlighting the hours and months, in GWh, with the highest curtailment.
report_heatmatrix(df_curtailment_unit)We could even extend the function to accept, as a parameter, the unit for which the report is to be made.
report_heatmatrix_unit(df_i90, unit='FEGPEM')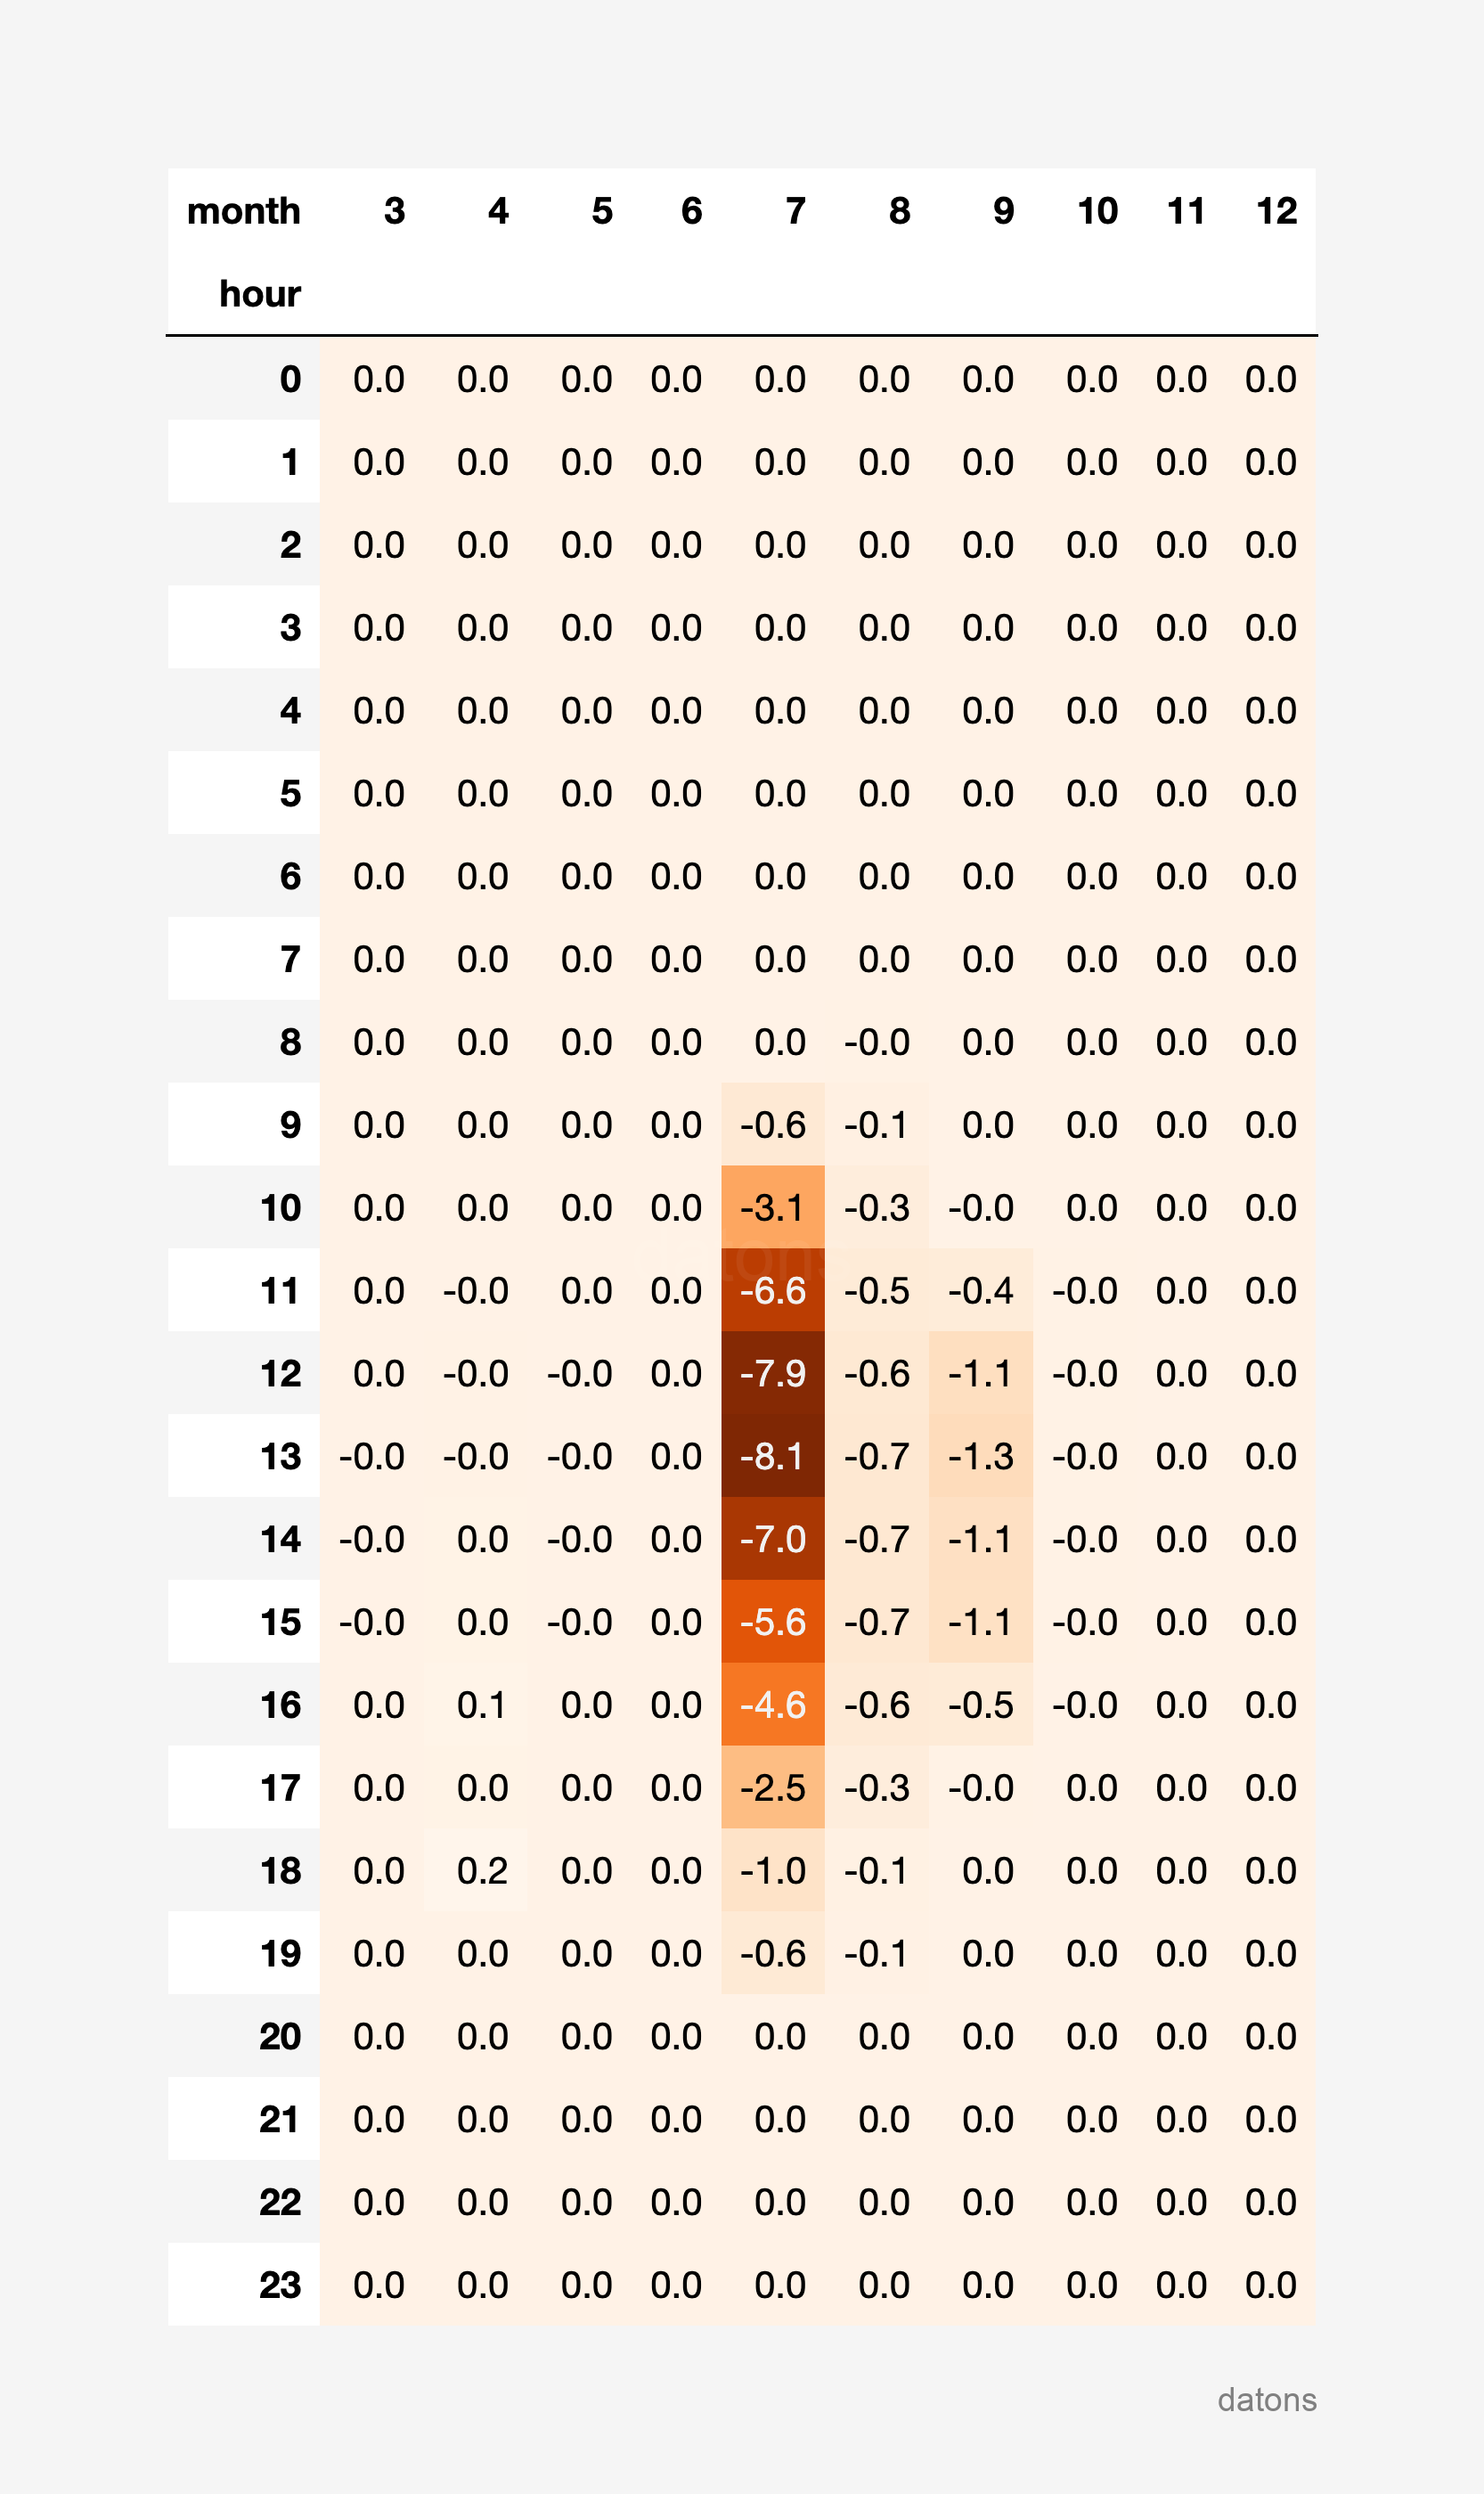
This is how Python allows us to automate and optimize the data analysis process. But not only that, we can also extend the process to analyze other relevant aspects such as curtailment by technology.
Curtailment analysis by technology
Cross multiple tables by common column
In the current table, we do not have the information of the technology associated with each energy programming unit. Therefore, we download the table that contains the detailed information of each energy programming unit.
And we cross it with the processed table of the I90 files.
df_i90_units = df_i90.merge(df_units, on="unit", how="left")Heat matrix
In the same way that we previously extended the function to accept the unit, we now extend it to also accept the technology.
report_heatmatrix(df_i90_units, technology="Solar fotovoltaica")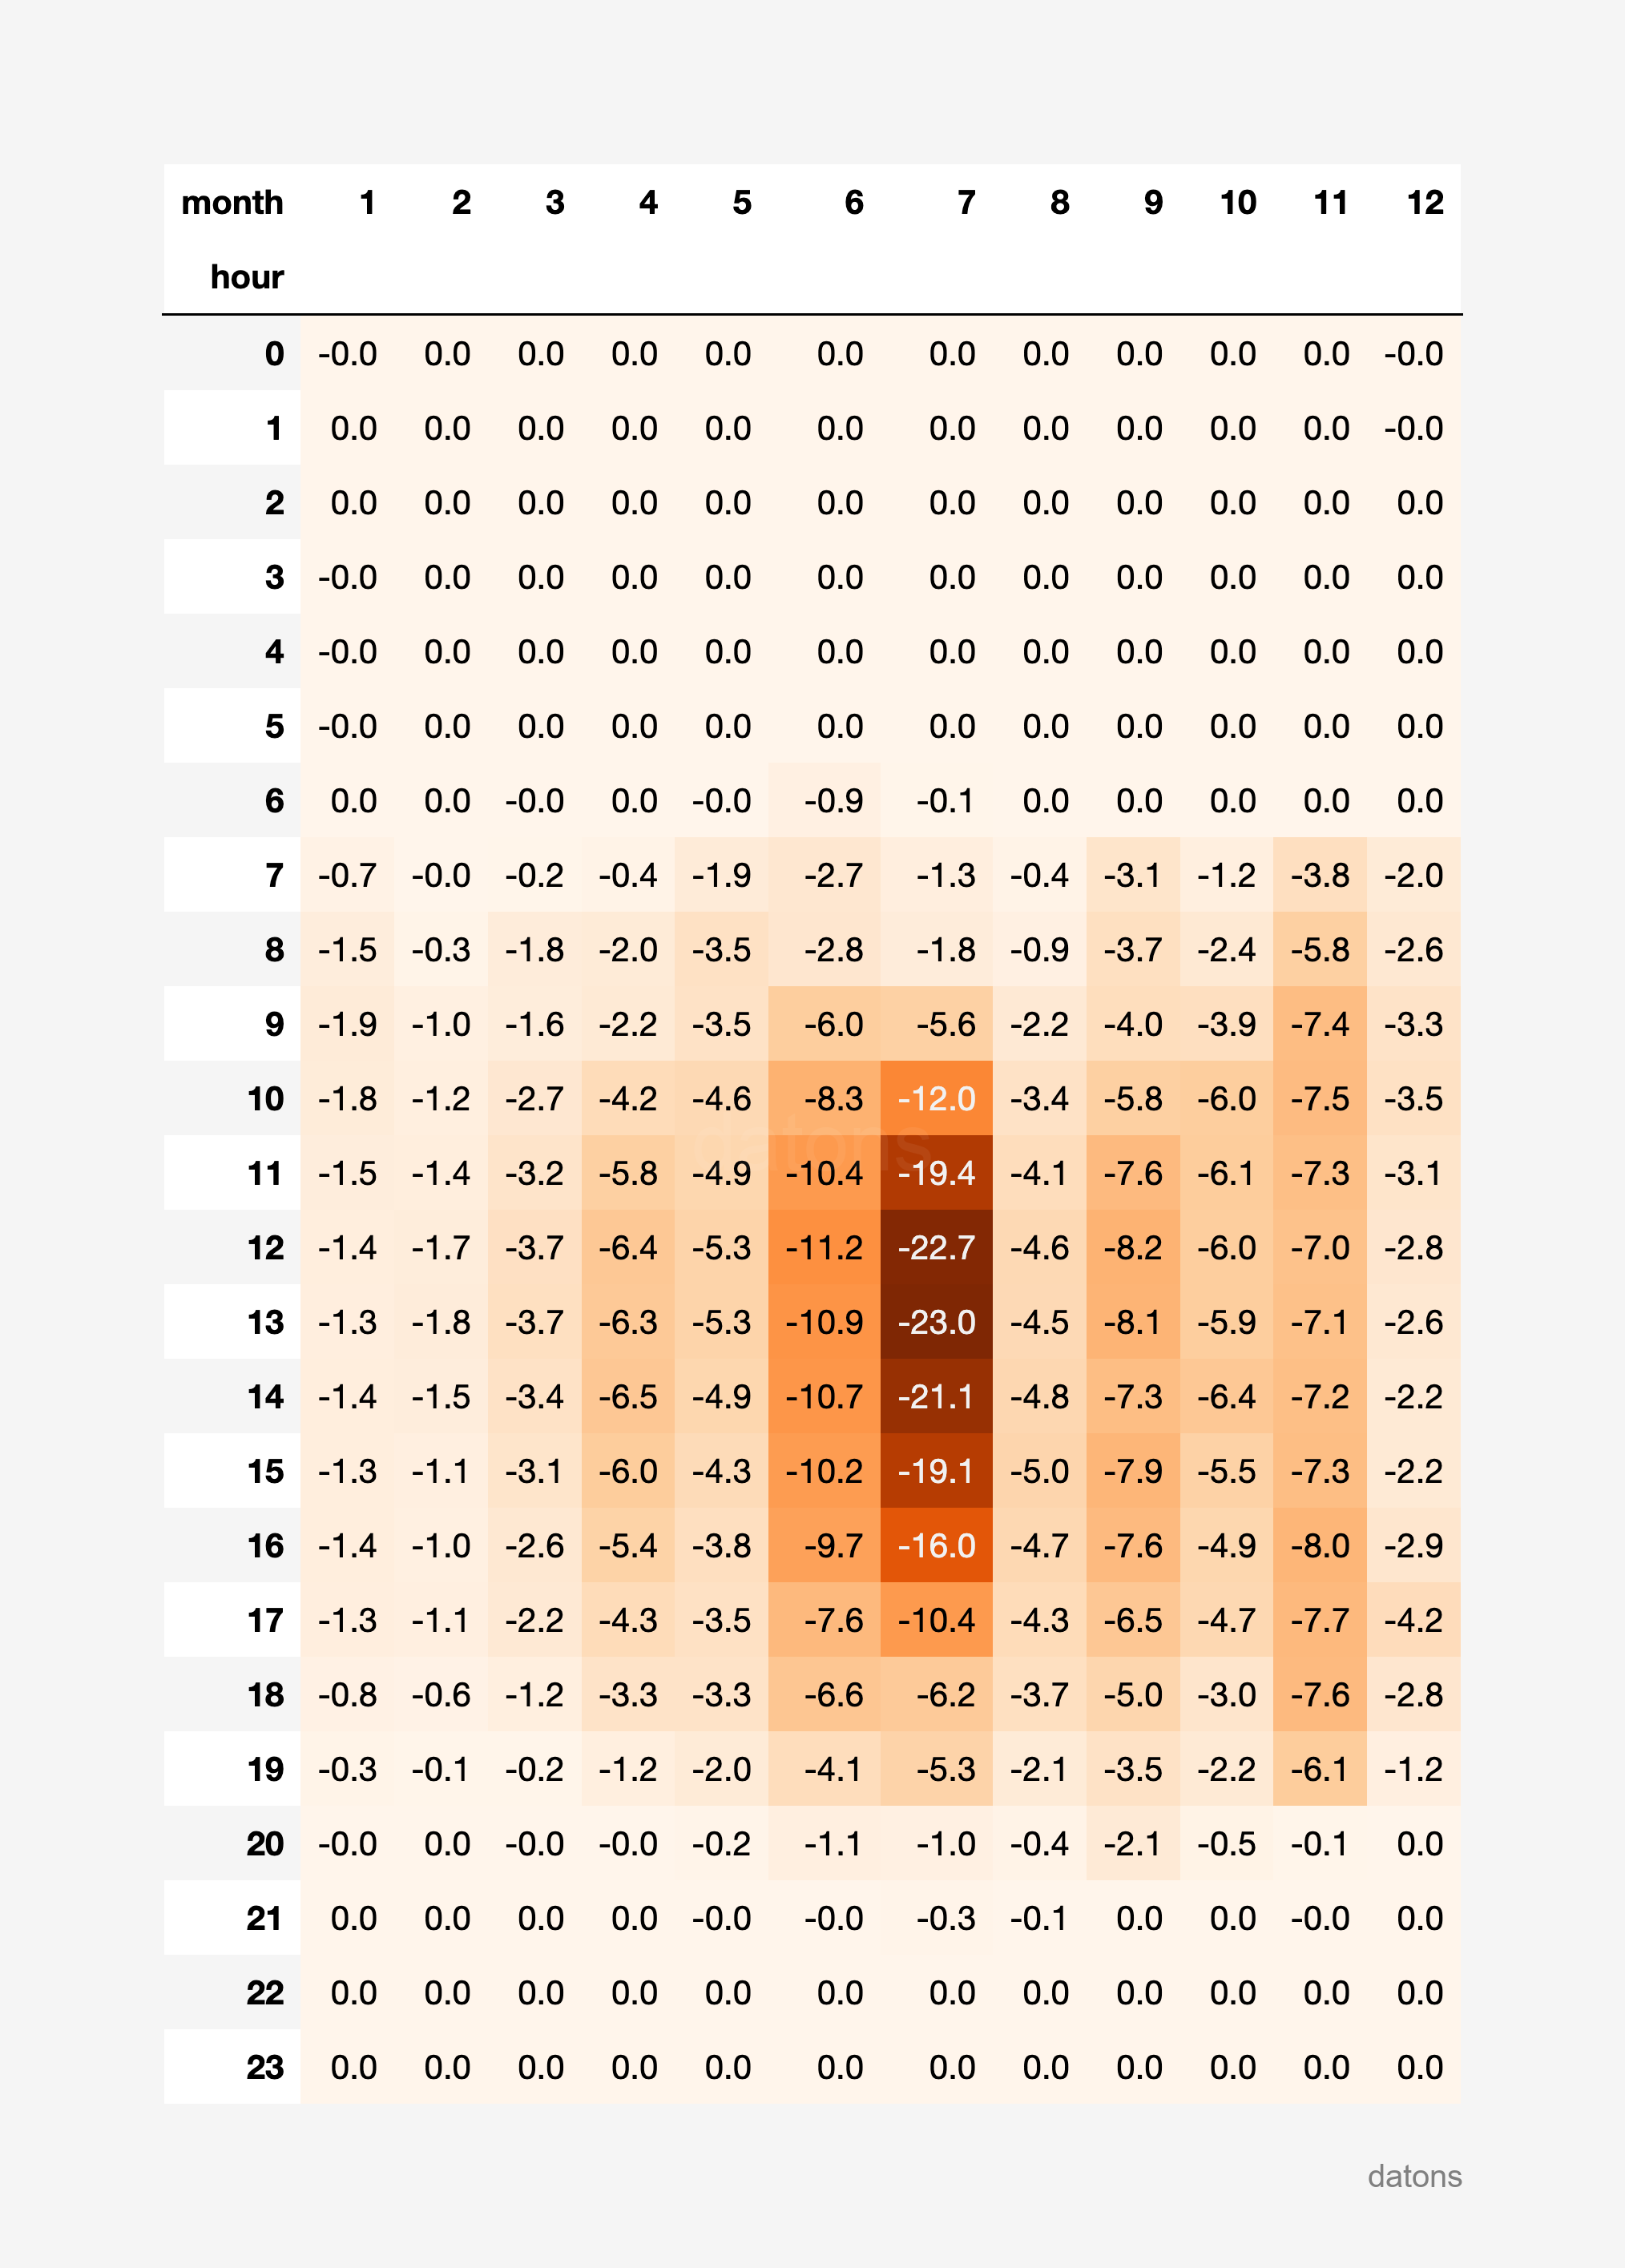
And of course, we can apply the same function for any technology. Let’s see the curtailment of the Eólica technology.
report_heatmatrix(df_i90_units, technology="Eólica")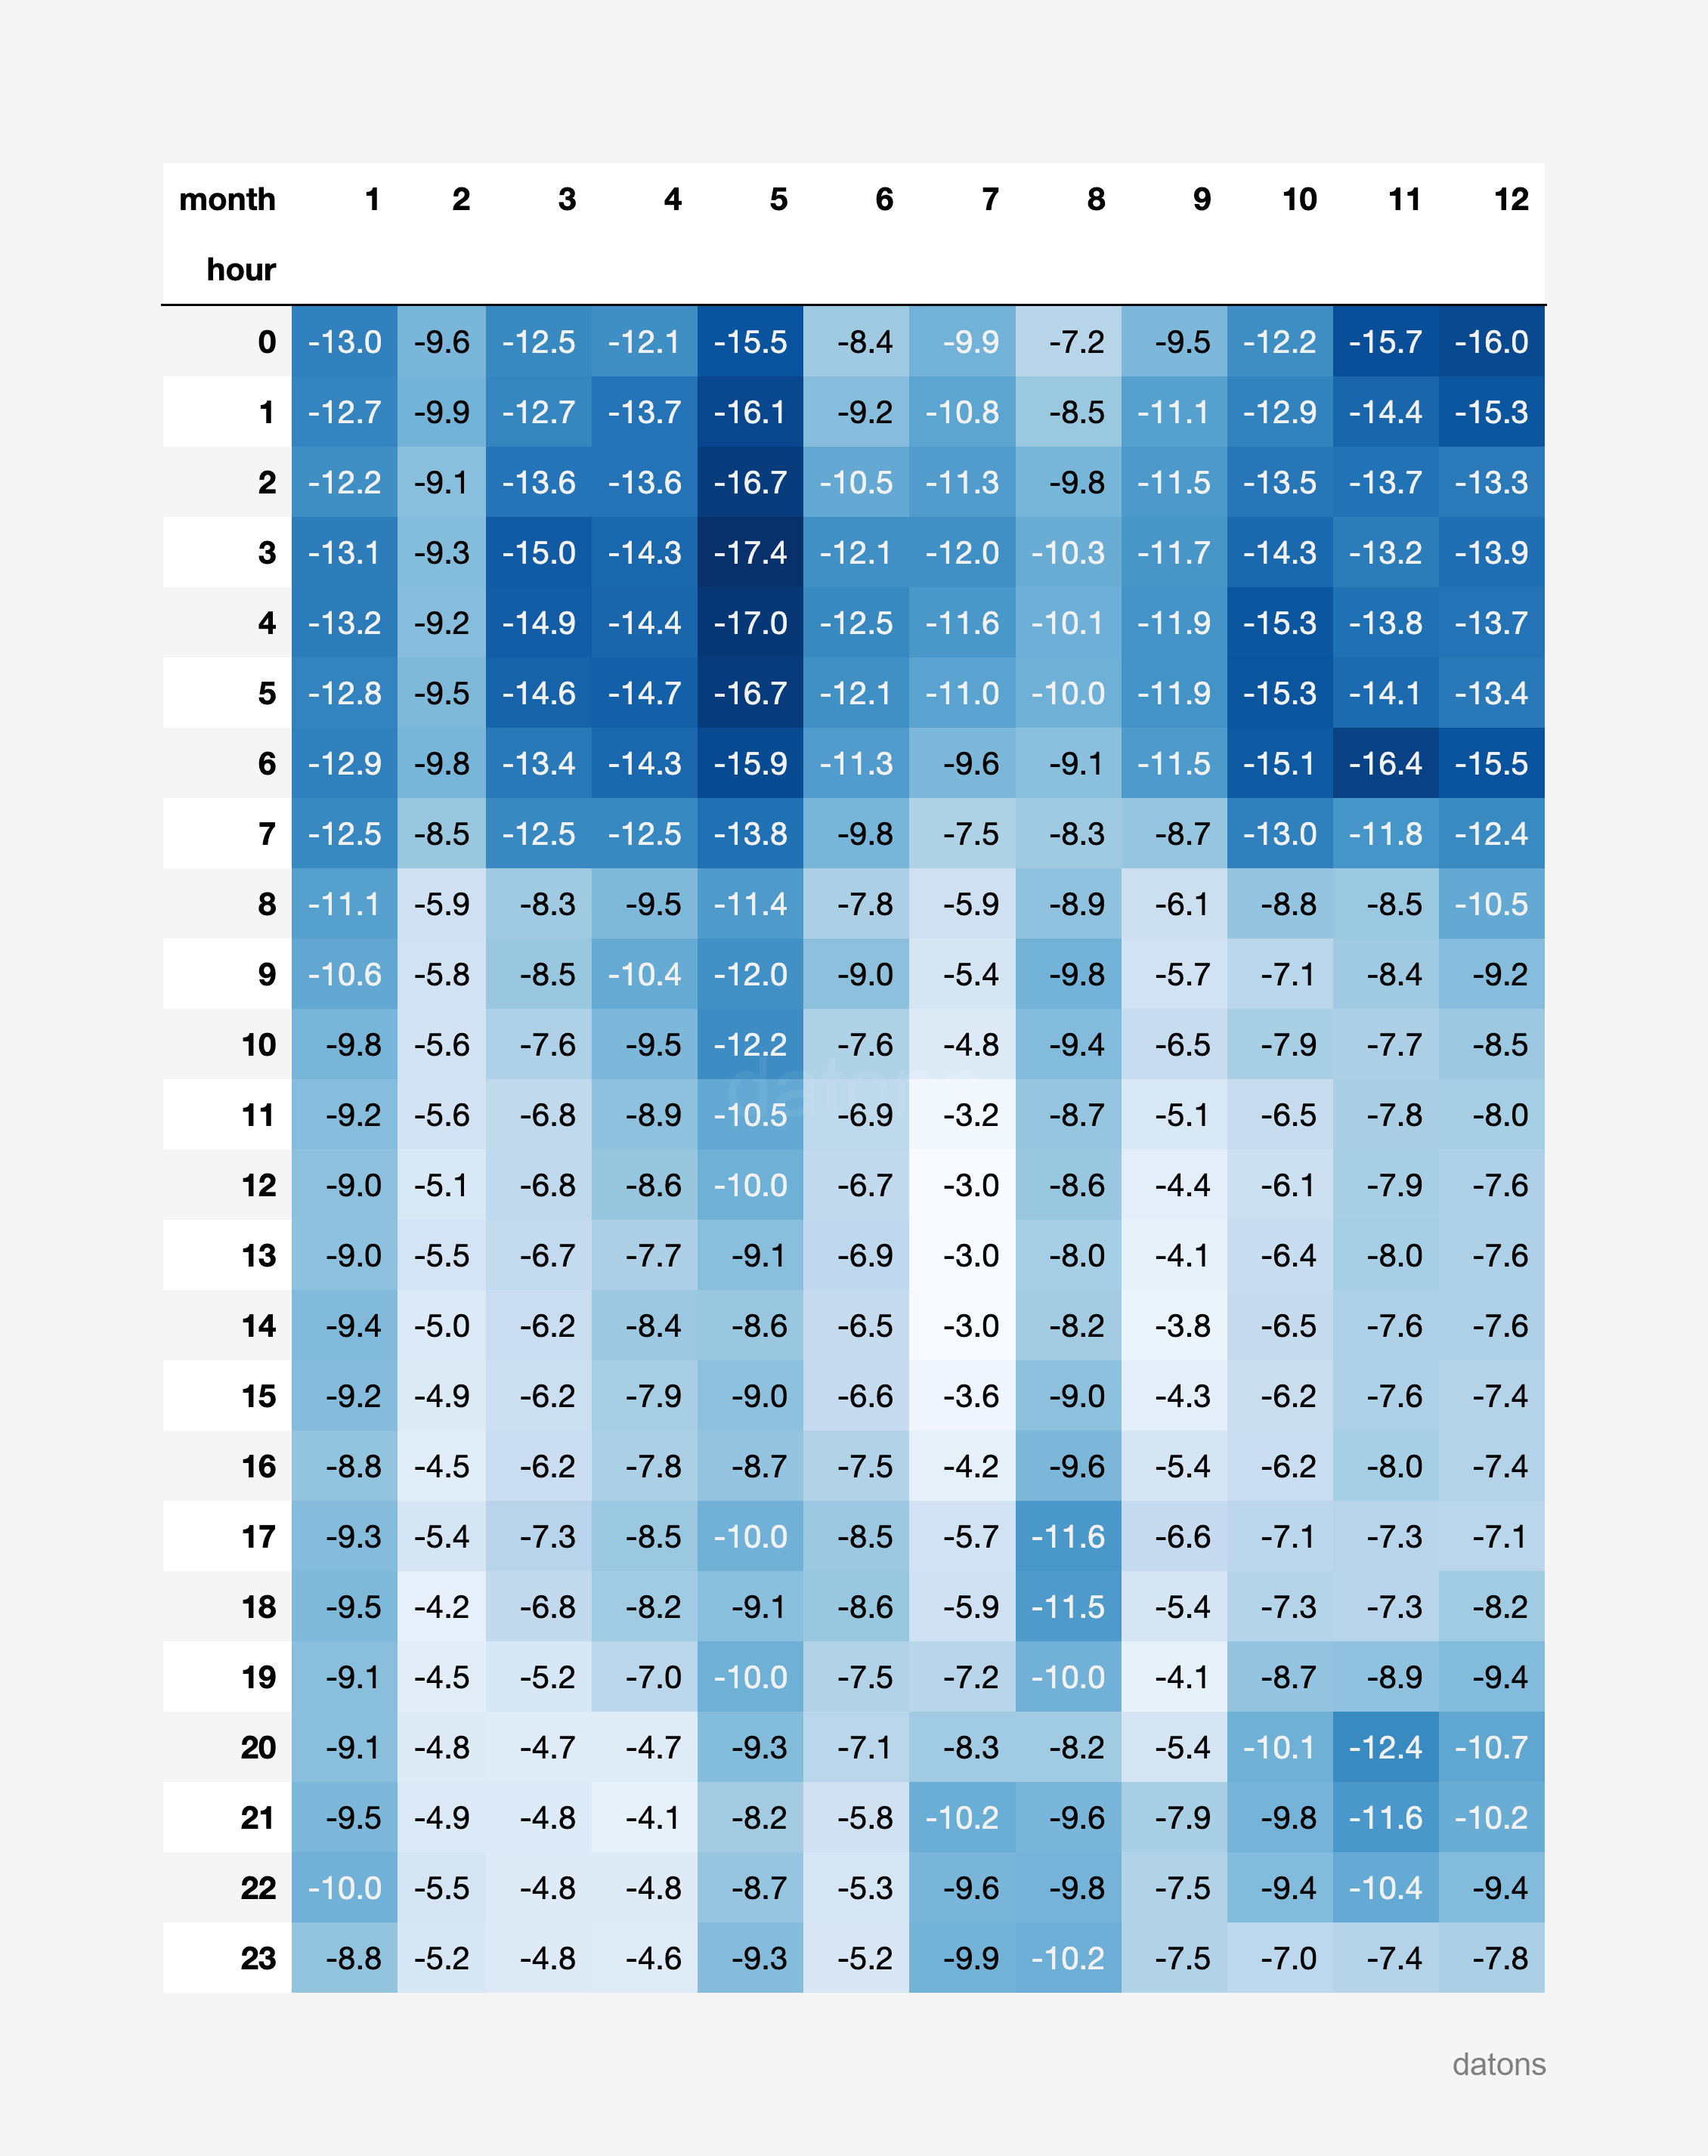
It turns out that wind energy presents more pronounced curtailment during night hours throughout the year, while photovoltaic solar energy presents more pronounced curtailment in the morning and afternoon hours during the summer months.
Conclusions
- Automation and scalability: By designing a preprocessing function and applying it to multiple files, an automated flow is achieved that avoids repetitive tasks in Excel.
- Standardization of formats: Converting data from wide to long format facilitates manipulation and analysis, allowing for uniform handling of information.
- Greater analytical flexibility: The ability to combine different datasets and filter or group information in Python provides a more complete and agile view than relying on separate Excel sheets.
- Reproducible processes: Python scripts make the entire process auditable and replicable, saving time in future iterations or with additional data.
- Report generation: From the consolidated table, personalized reports (heat matrices, comparative analyses, etc.) can be generated and exported back to Excel for distribution.
Keep reading
Related articles you might enjoy
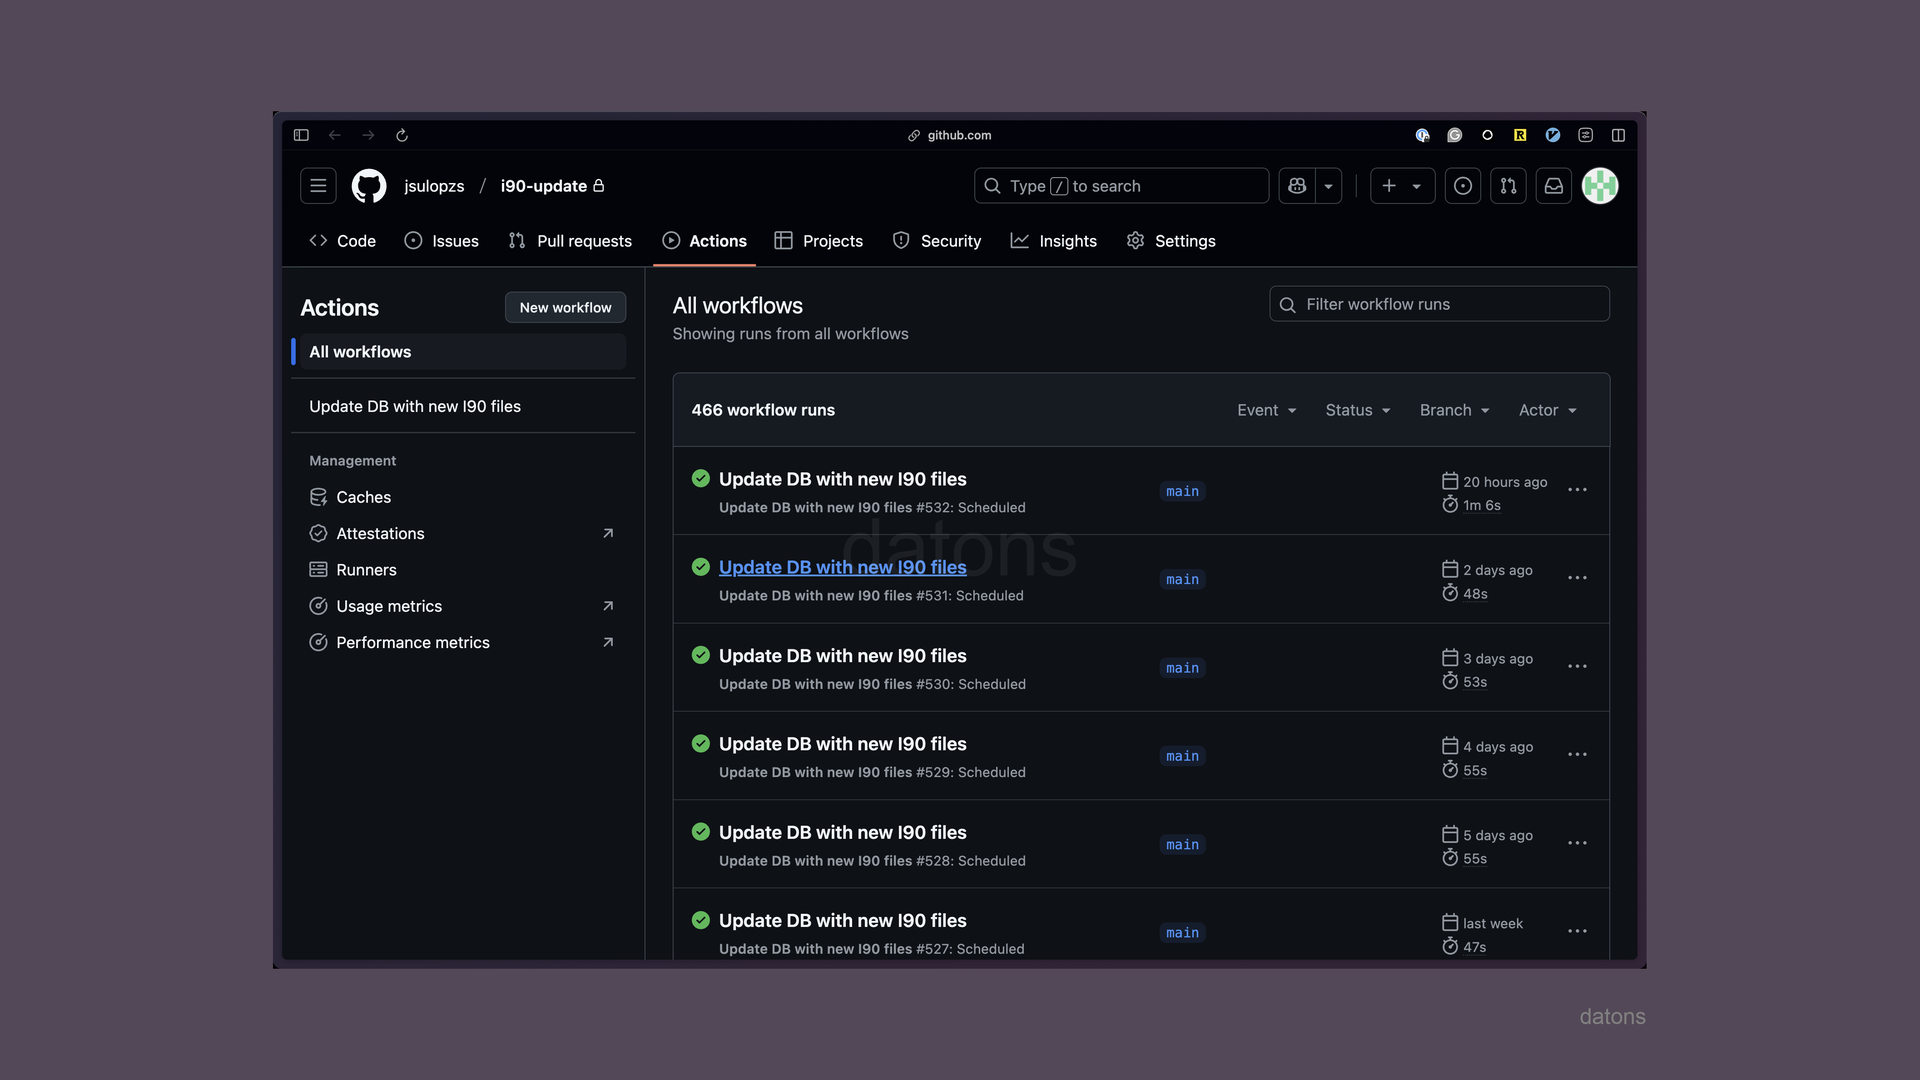
Run scripts on autopilot every day to update database with GitHub Actions
Having a database that needs to be updated with new data published every day, how to automate script execution with GitHub Actions?
Read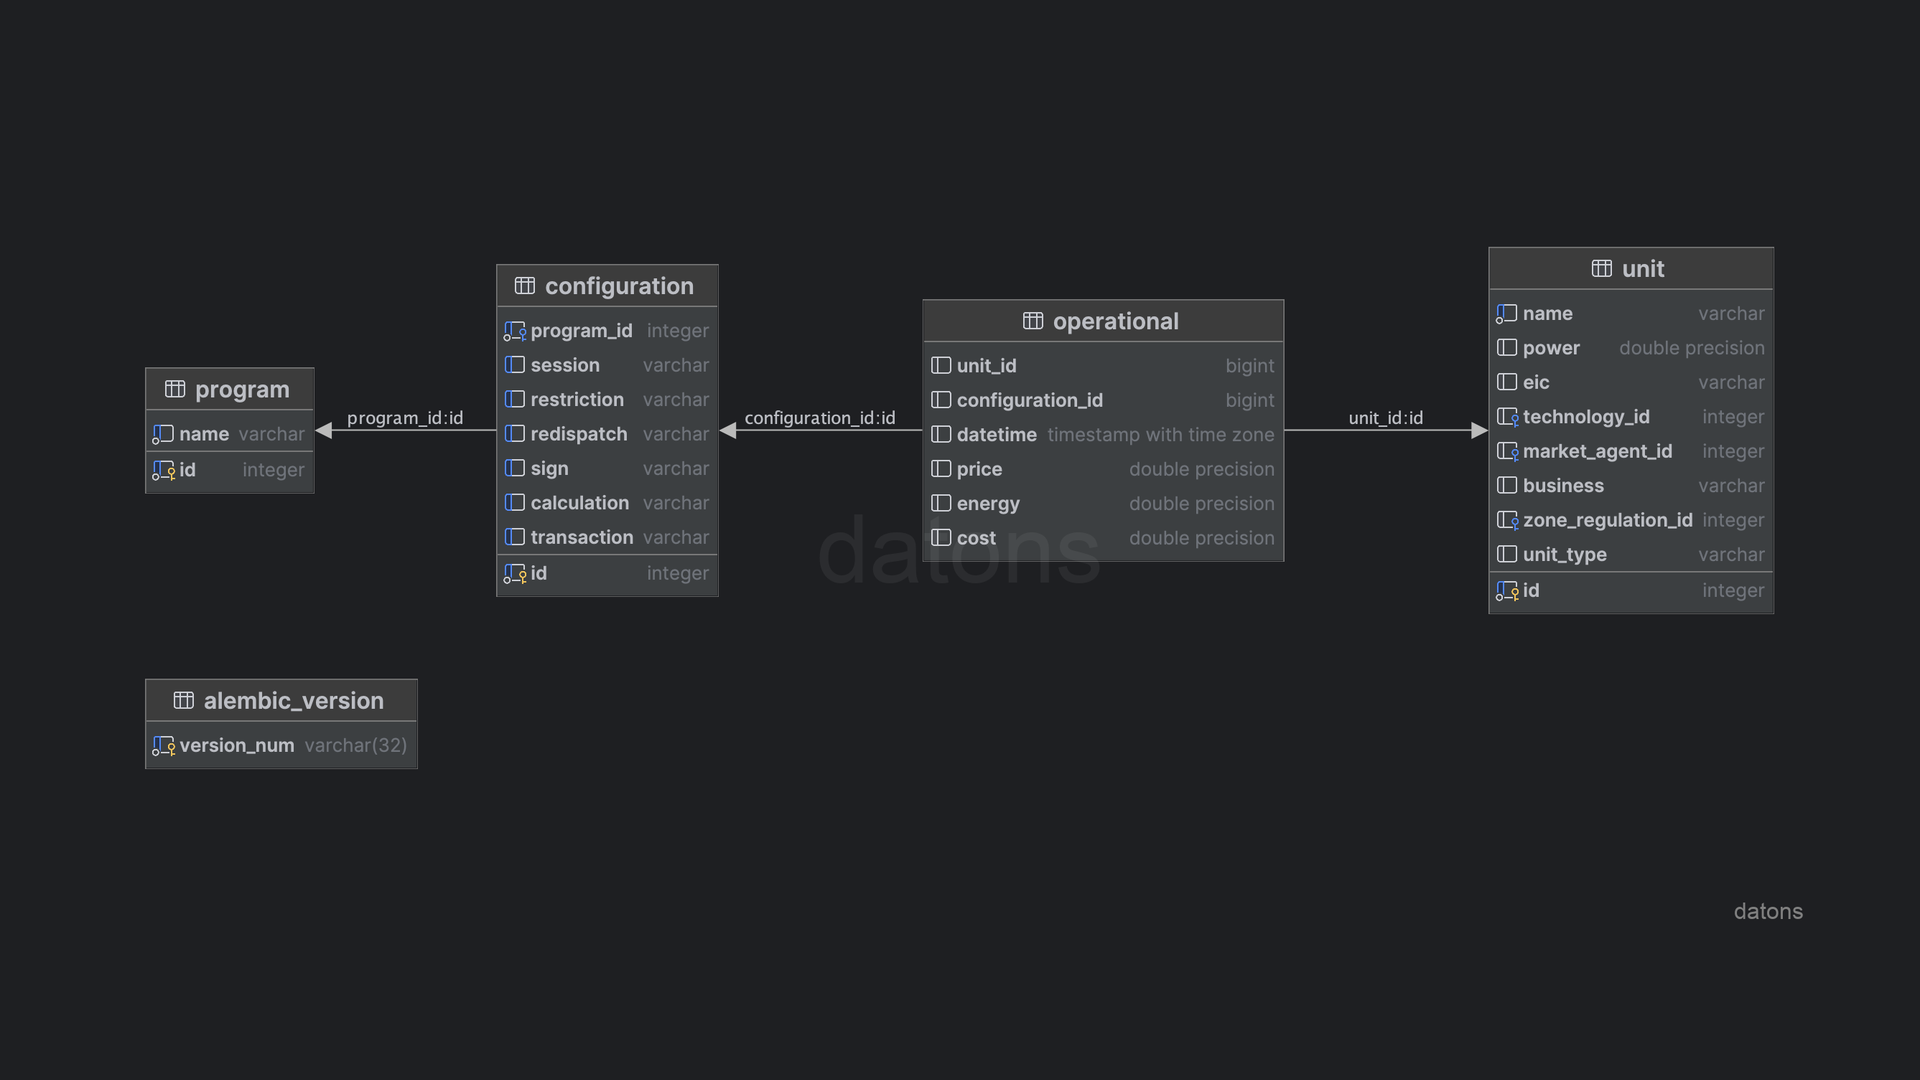
Normalized database for querying I90 files from REE
Understand the process of creating a normalized database to query historical information of energy programming units in the Spanish electrical system with practical examples.
ReadExcel Automations
Transform your Excel calculations into robust, scalable Python scripts and pipelines with Excel Automations.
Read